Whether it’s a fat population, high rate of STDs, best University value, or most presidents born there, every state has to rank both #1 and dead last in at least one unsavory category. Right? That’s just how math works.
We took it upon ourselves to do the research, combing the US Census Bureau, and Google, for each of the fifty states best/worst, and here’s what we found:
(Scroll down to see what your state either needs to keep on doing, or stop doing.)
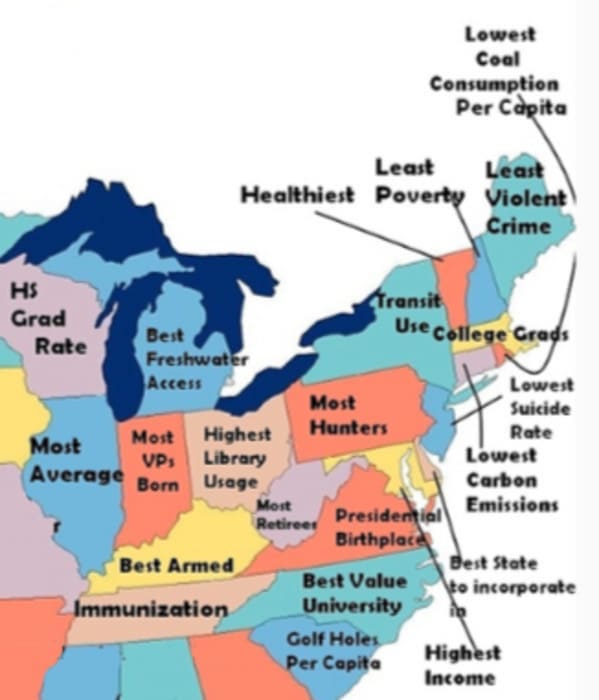
What States Are Best At – The United States Of Awesome
The Southeast
The Northeast
Full Map
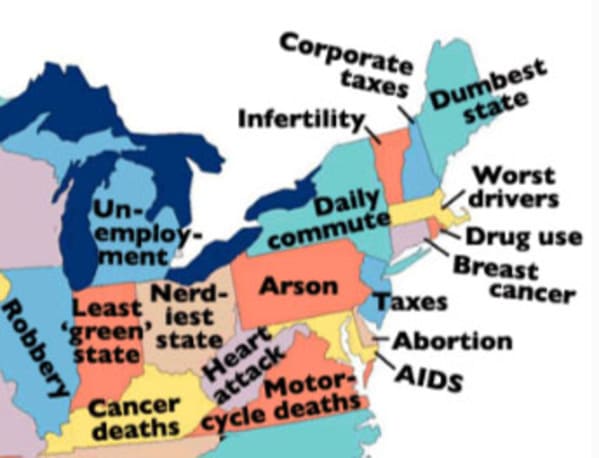
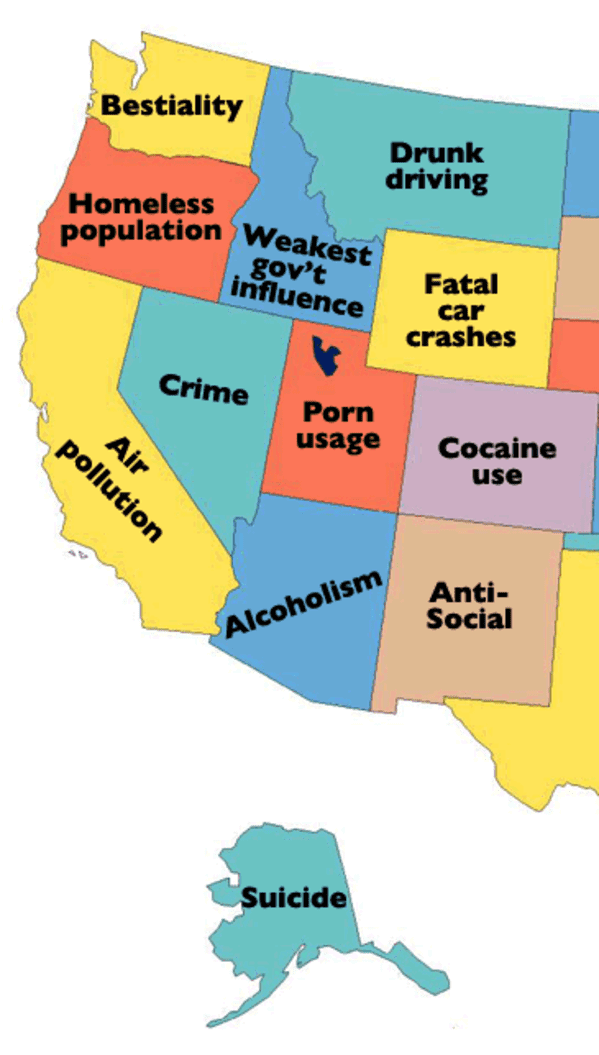
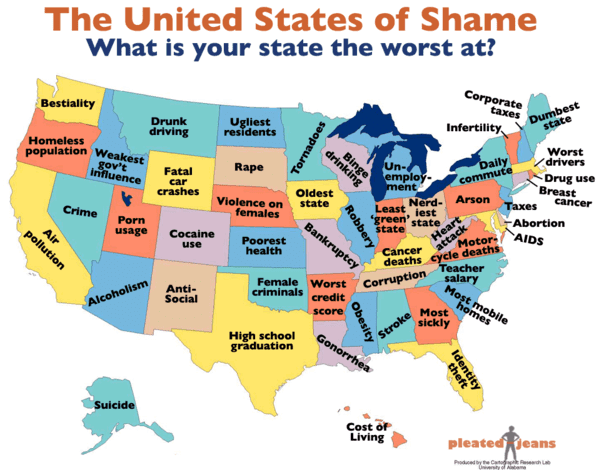
What States Are Worst At – The United States Of Shame
The Northeast is bringing shame.
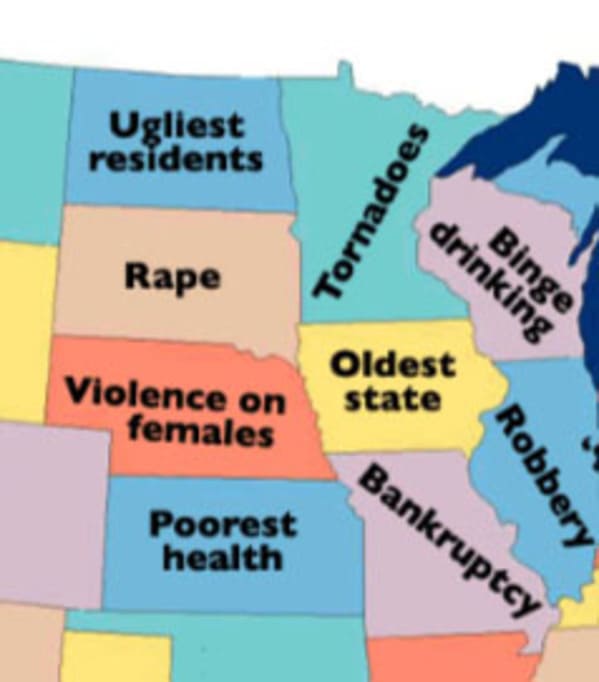
It’s going down in the Midwest.
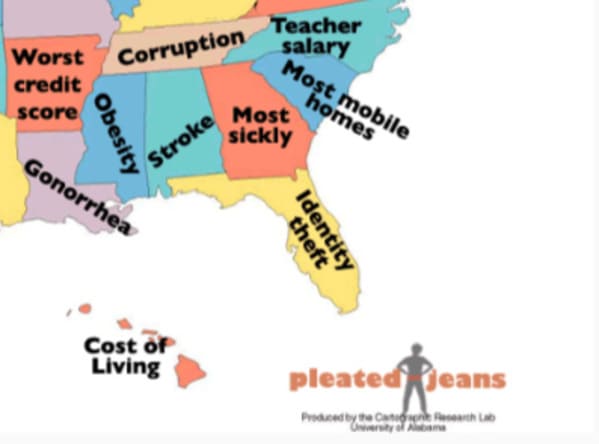
The Southeast
The not-so-Best Coast
The South is letting us down.
Full Map
Even More Specific Stats:
1. Alabama: highest rate of stroke (3.8 percent) (tied with Oklahoma)
2. Alaska: highest suicide rate (23.6 suicides per 100,000 people in 2004)
24. Mississippi: highest rate of obesity (35.3 percent of the total population)
BONUS facts: Mississippi ranks last in the most number of categories. These include the highest rate of child poverty (31.9 percent), the highest rate of infant mortality (10.3 percent) lowest median household income ($35,078), highest teen birth rate (71.9 per 1,000 women aged 15 to 19), and the highest overall rate of STDs.
27. Nebraska: highest rate of women murdered annually
28. Nevada: highest rate of violent crime (702.2 offenses per 100,000 people). BONUS fact: Nevada also has the highest rate of foreclosure (one in 99 houses)