Data Is Beautiful (16 Charts & Graphs)
I love a good graph or chart. It’s truly fascinating to see someone break down a ton of data and fit it efficiently into an infographic I, an idiot, can understand. Keep kicking ass, nerds.
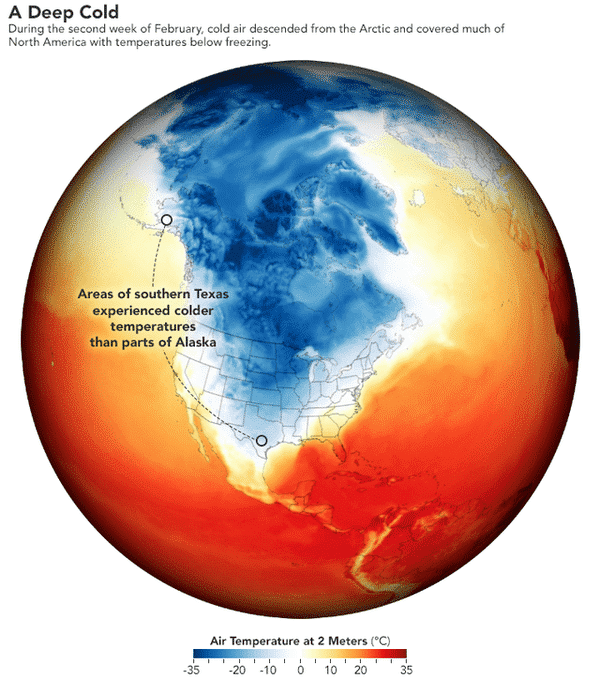
1. Southern Texas got as cold as Alaska. The freezing temps prompted dangerous blackouts in several cities.
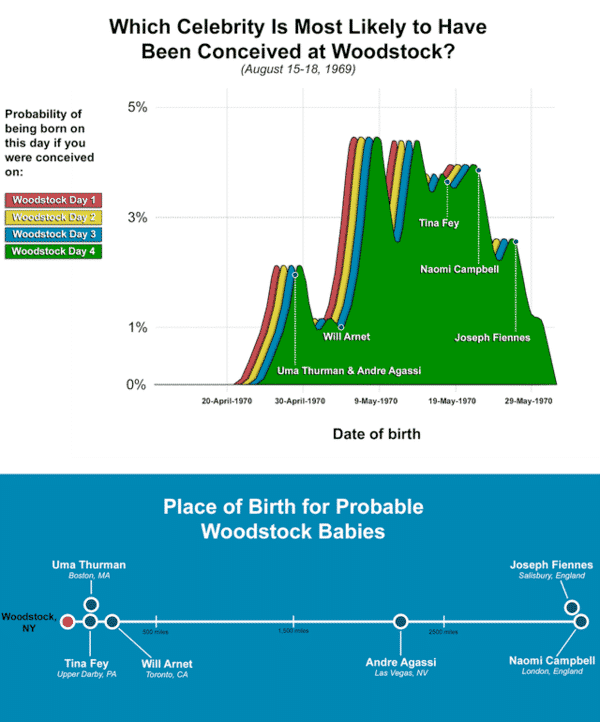
2. Had a sick day yesterday, decided to figure out which famous person, based on their date and location of birth, was most likely conceived at the 1969 Woodstock festival. It’s Tina Fey.
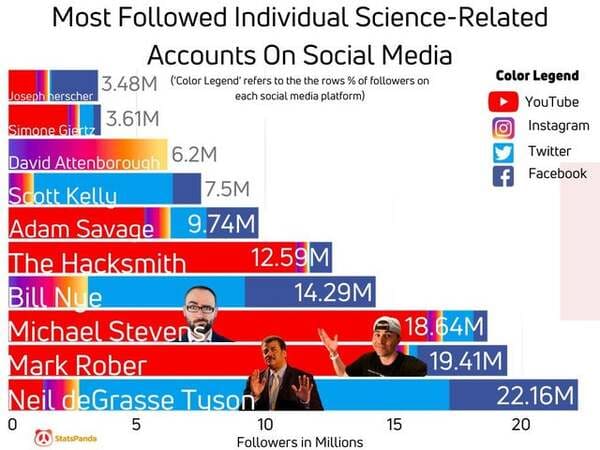
3. Most Followed Individual Science-Related Accounts On Social Media
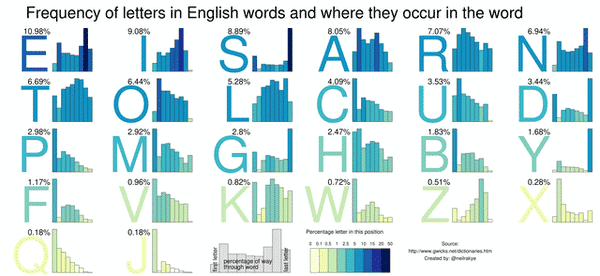
4. Frequency of letters in English words and where they occur in the word.
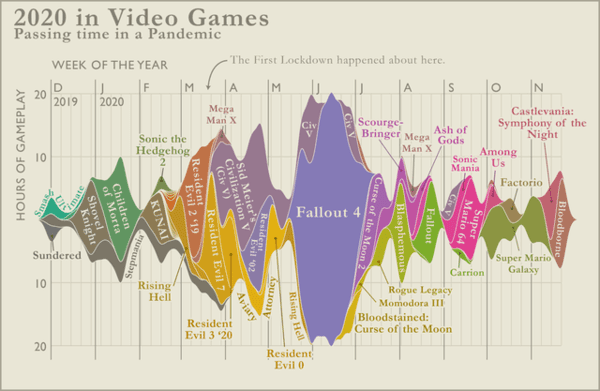
5. I tracked all of my gaming time between December 2019 and November 2021
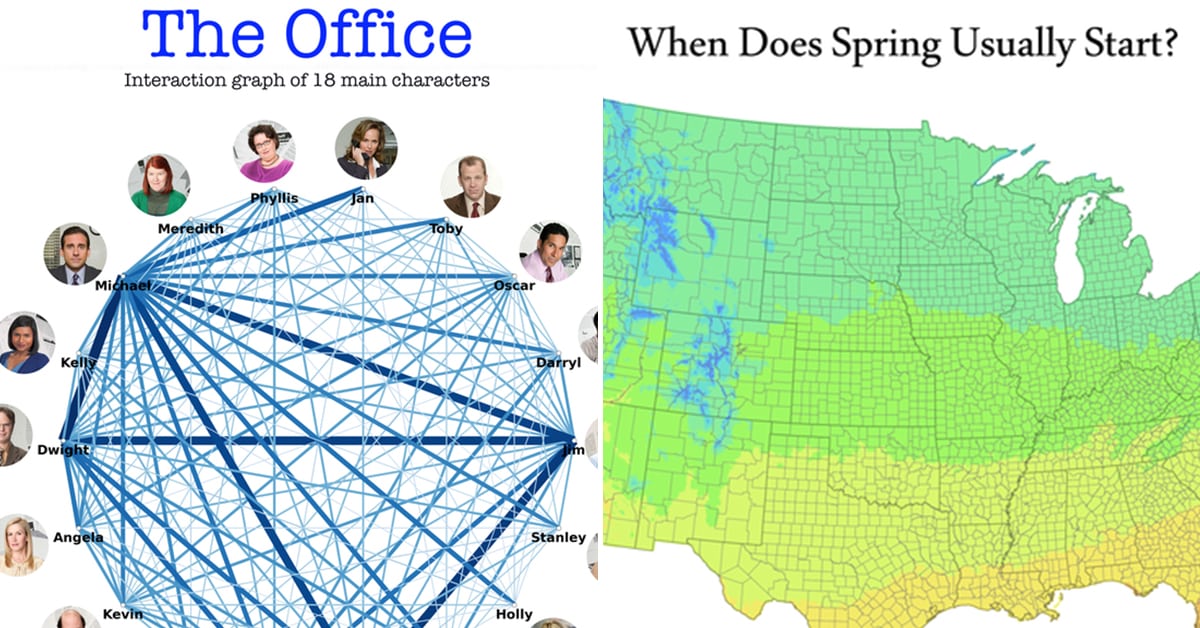
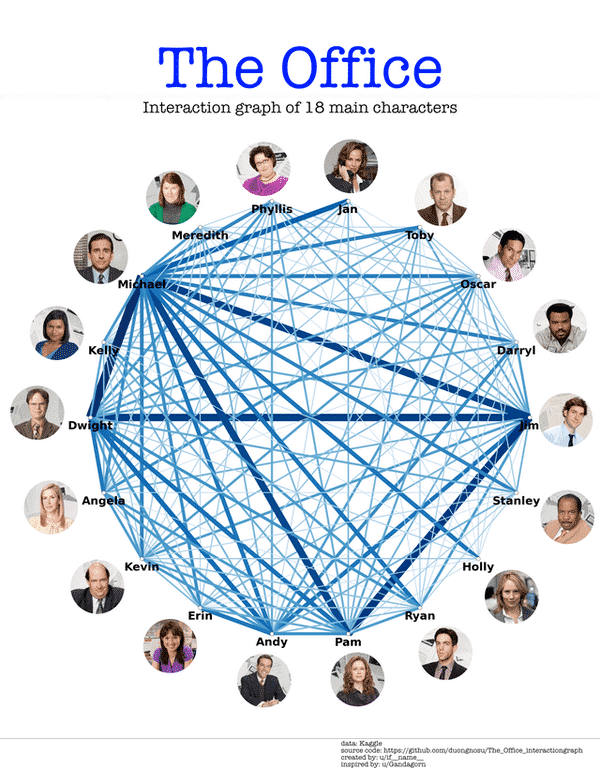
6. Interaction graph of 18 characters in The Office
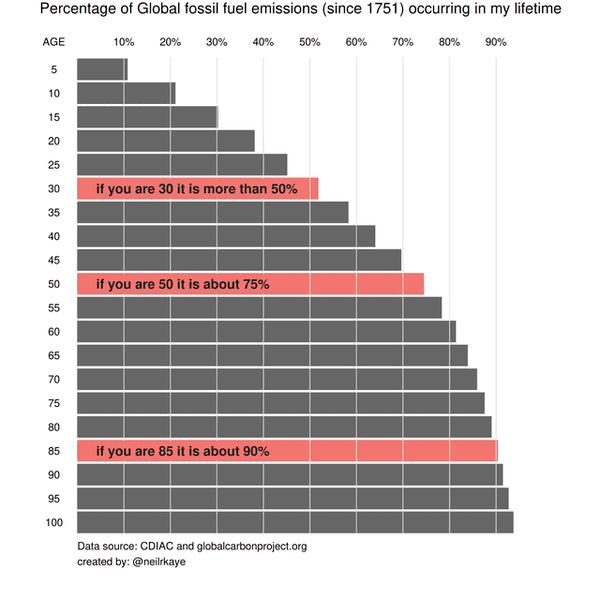
7. Percentage of all fossil fuel emissions that have occurred in my lifetime.
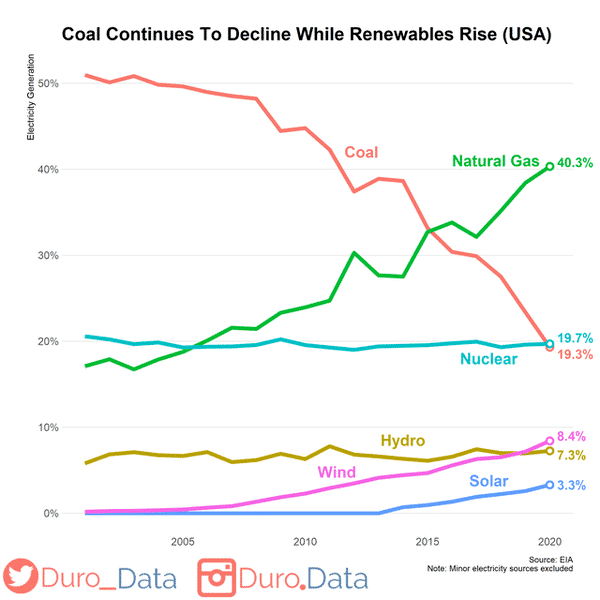
8. Coal now produces less electricity than nuclear energy, wind, and solar energy continue to grow (USA)
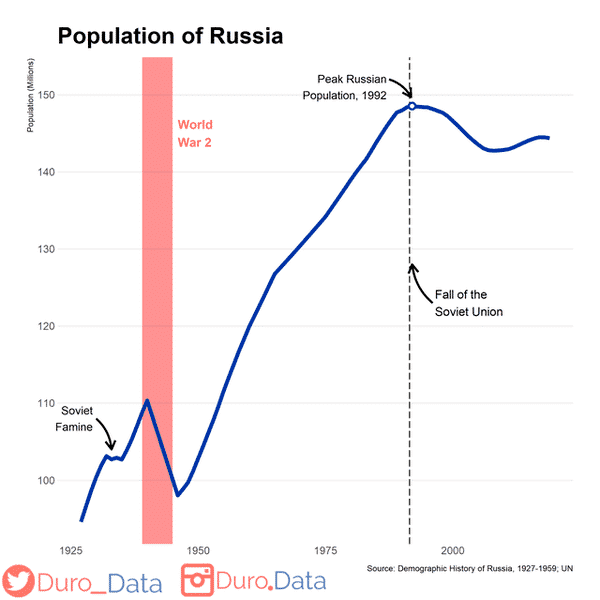
9. The population of Russia declined by more than 12 million during World War 2
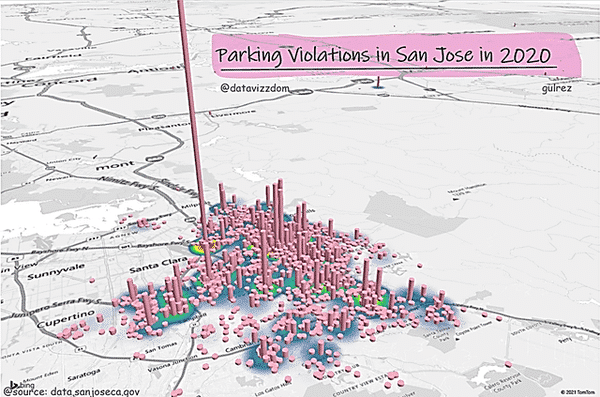
10. Beauty of Parking Violation tickets issues at San Jose in 2020
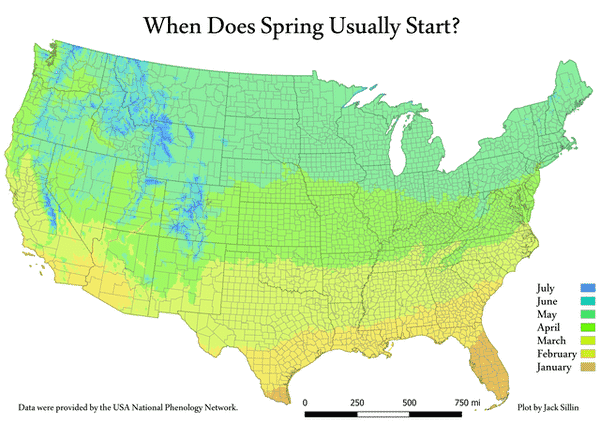
11. When Does Spring Usually Arrive?
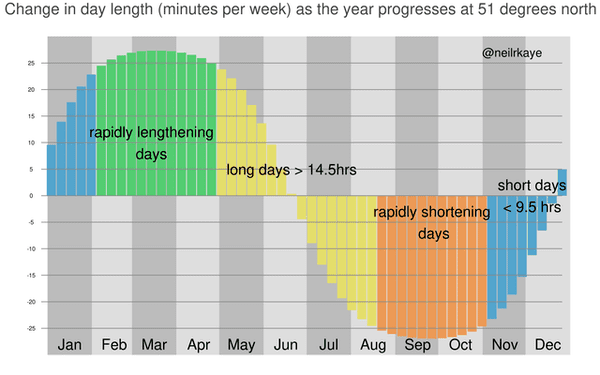
12. Weekly gain/loss of minutes of daylight over the year at 51 degrees north (where I live), we are getting an extra 26 minutes of daylight this week!
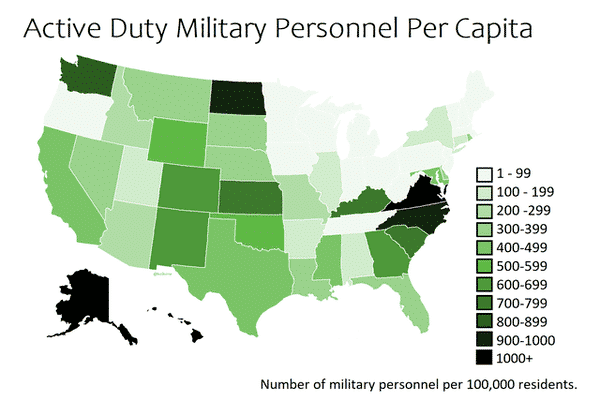
13. Active Duty Military Personnel Per 100,000 Residents
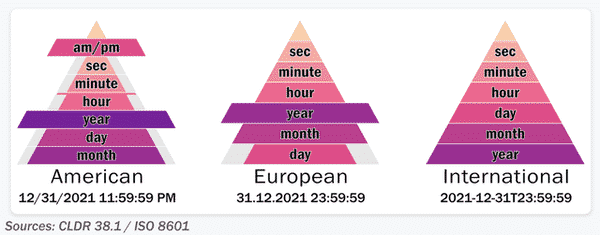
14. Correct graph of the common date formats, with accurate representation of the 12 hour system
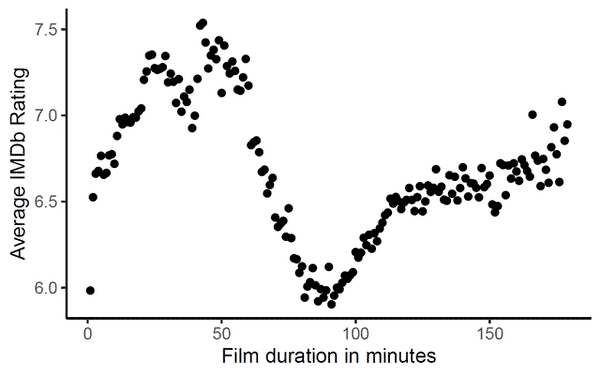
15. Relationship of film length and IMDb rating.
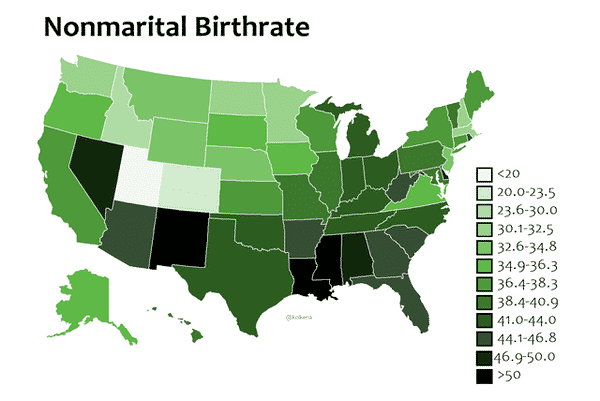
16. Nonmarital Birthrates by State
