Data Is Beautiful (21 Charts & Graphs)
I love a good graph or chart. It’s truly fascinating to see someone break down a ton of data and fit it efficiently into an infographic I, an idiot, can understand.
Keep kicking ass, nerds.
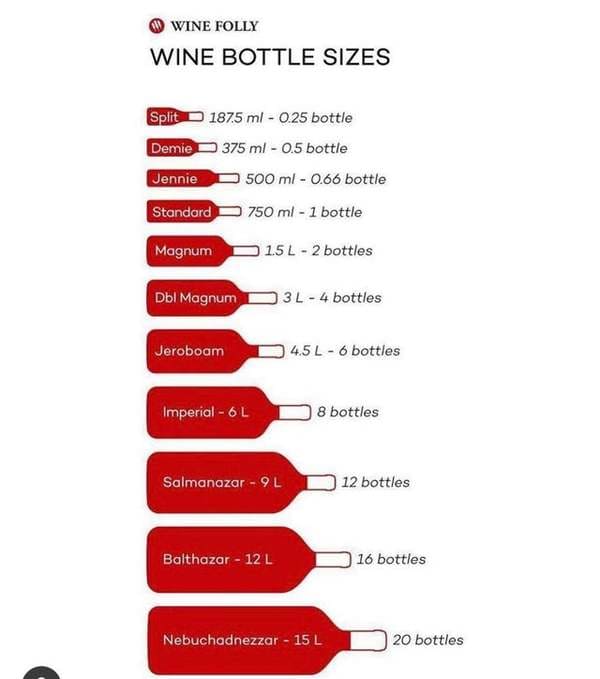
1.
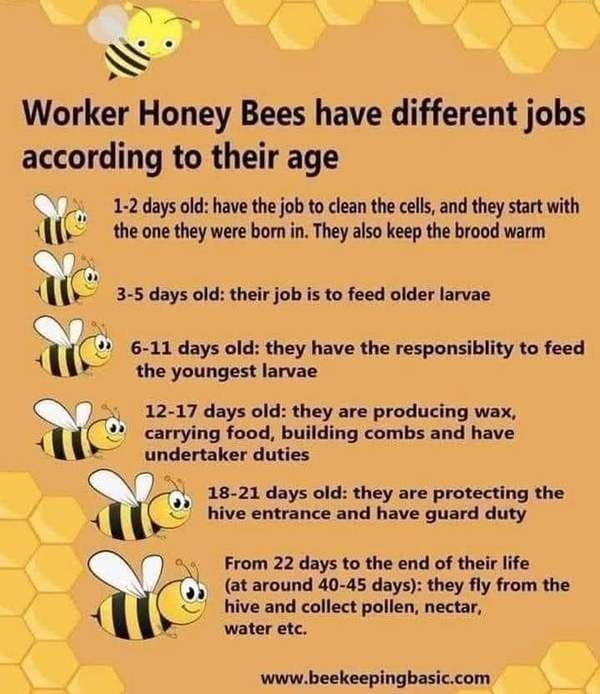
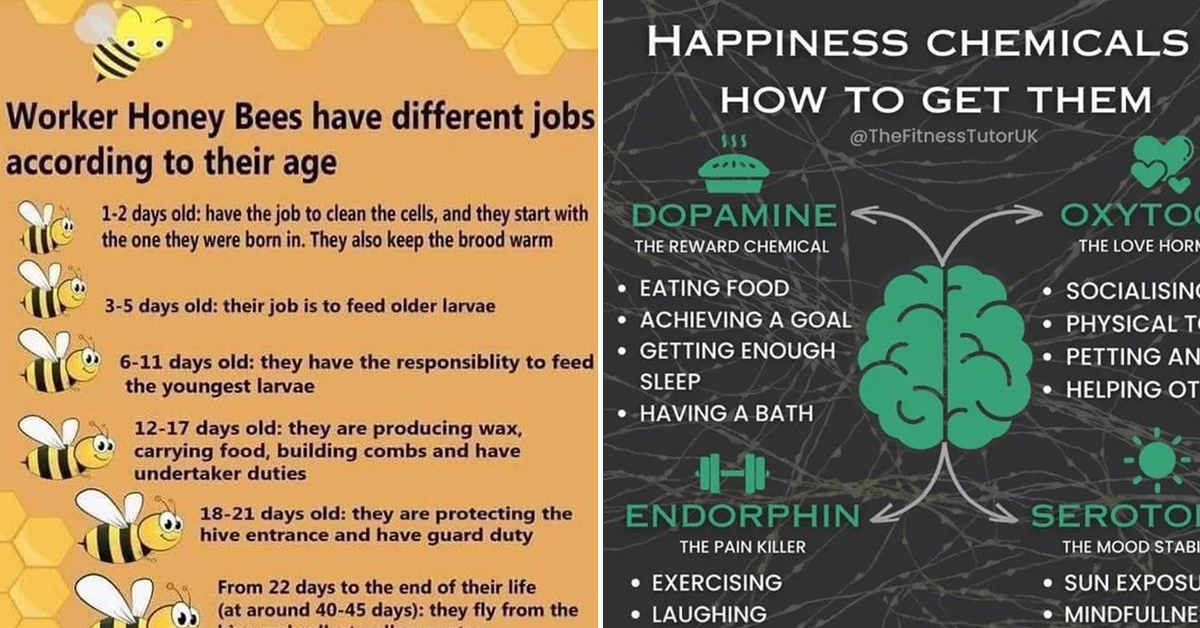
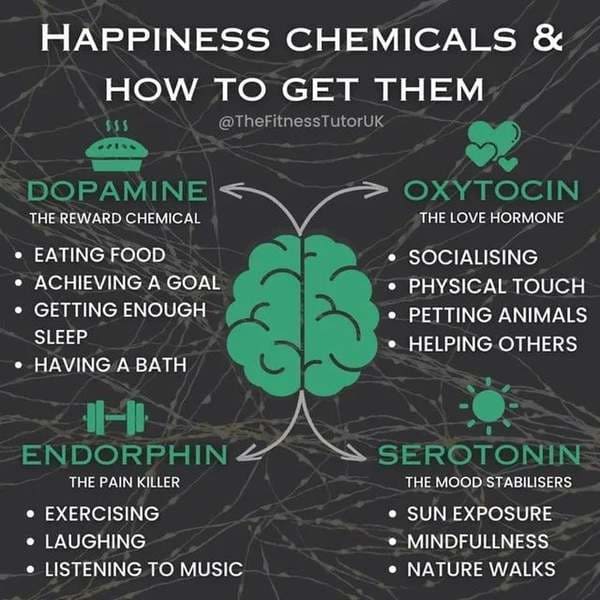
2.
3. Not sure if this counts because there aren’t actually words, but I just think the life cycle of a strawberry is neat.

4.
5.
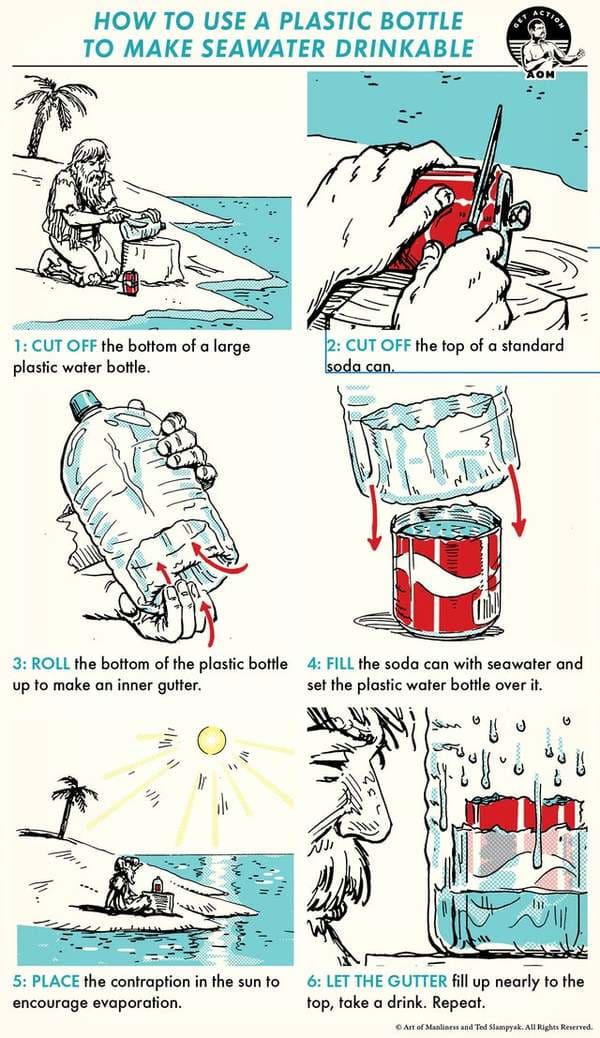
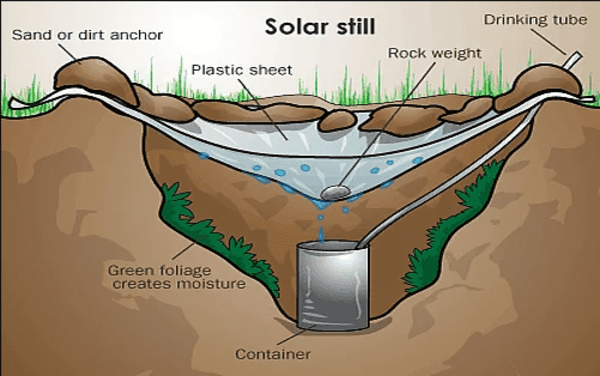
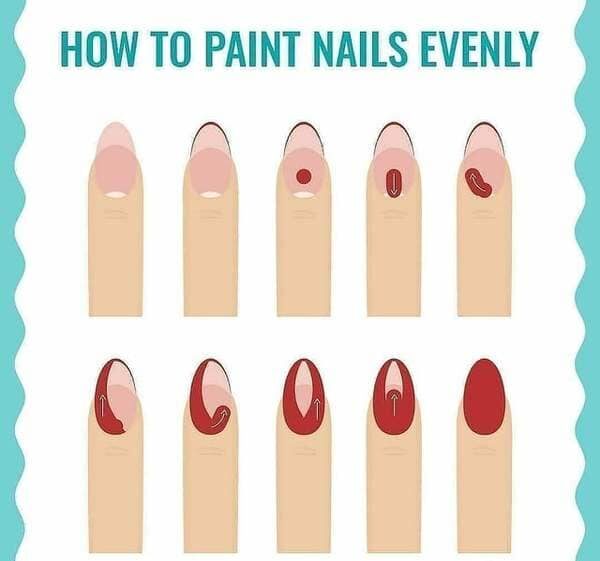
6. Just a reminder of this cool trick.
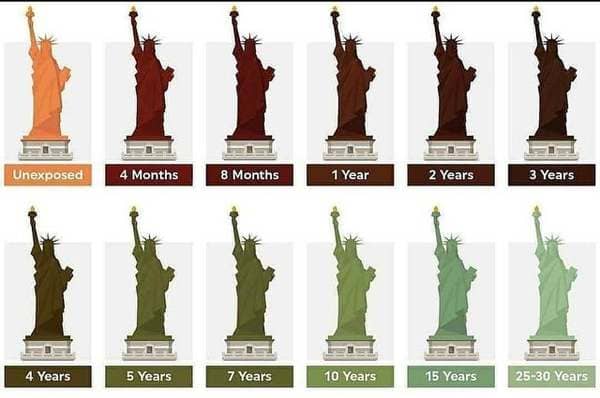
7. How rust took over the statue of liberty these years.
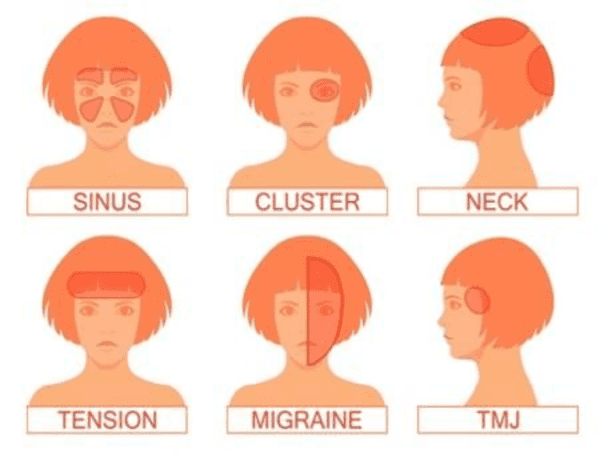
8. Woke Up With A Headache Today
9.
10.
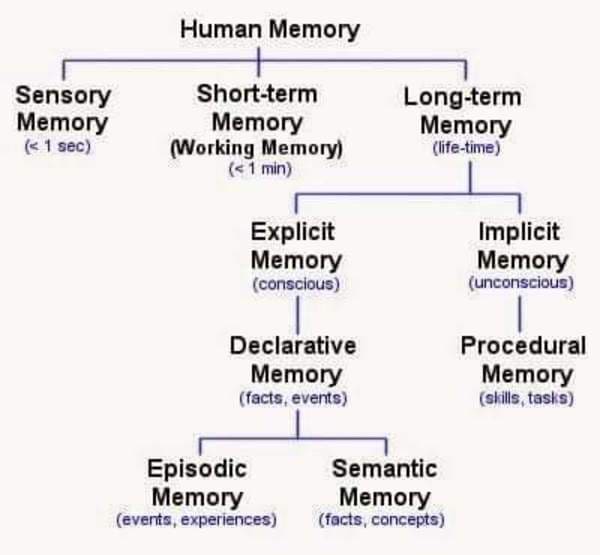
11. Human Memory and its duration.
12.
13.
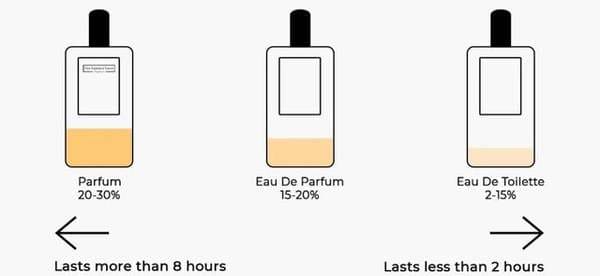
14. Perfume guide.
15.
16.
17.

18.
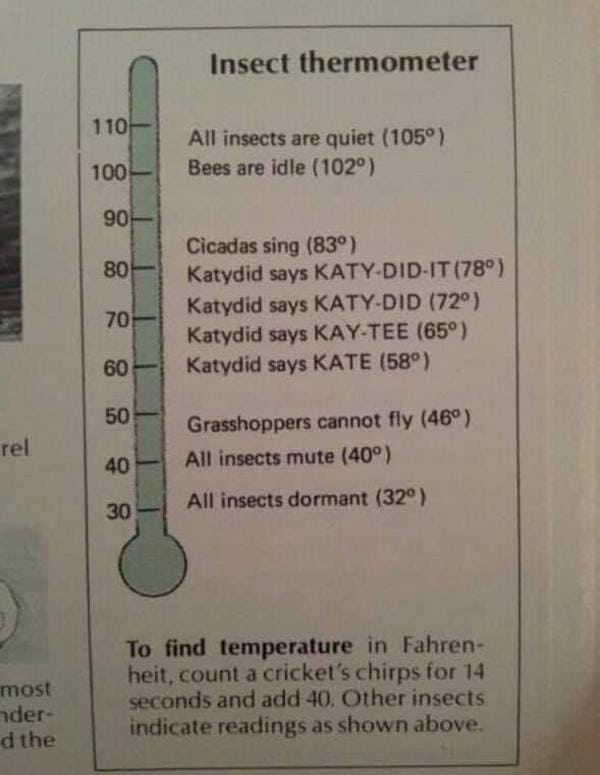
19. Using different bug noises to tell the temperature.
20.
21.