Data Is Beautiful (21 Charts & Graphs)
I love a good graph or chart. It’s truly fascinating to see someone break down a ton of data and fit it efficiently into an infographic I, an idiot, can understand.
Keep kicking ass, nerds.
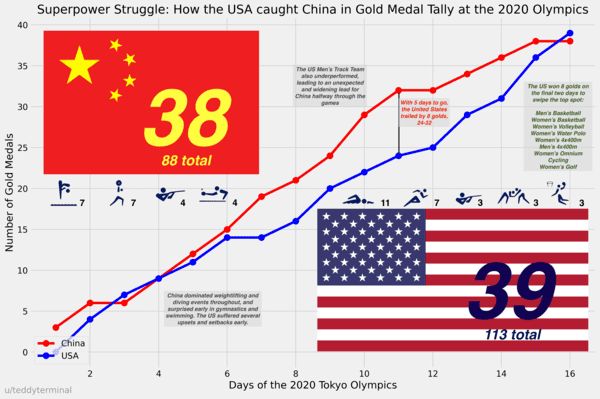
21. A Photo-Finish Race for the Most Gold Medals at Tokyo 2020: USA 39, China 38
20.
19.
18. Where can you afford to live on the minimum wage in the United States?

17.
16.
15.
14. My single Finnish income and expenses 2020 in EUR

13.
12.
11.
10.

9.
8.
7. US States by Olympic Athletes Per Capita

6.
5.
4.
3.

2.

1.