“Data Is Beautiful”: 30 Cool Guides, Charts, And Graphs That Make Learning Fun Again
Sometimes a good chart can do what a thousand thinkpieces can’t: make something click. The subreddit r/DataIsBeautiful is packed with visualizations that break down the world in clever, surprising, and oddly satisfying ways.
These informative charts and infographics offer new perspectives on everything from everyday habits to global trends. They’re informative, unexpected, and might rewire how you view the world (or at least how you spend time online).
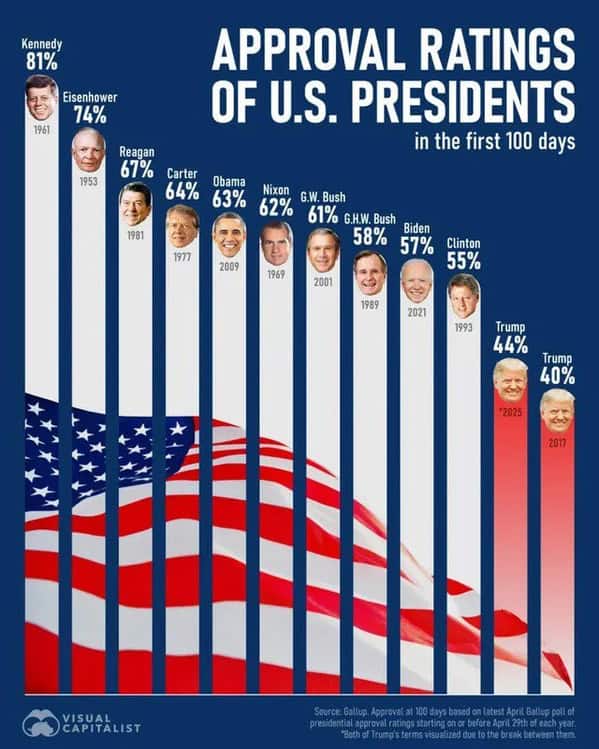
1. “A cool guide for Approval Ratings of U.S. Presidents in their first 100 days”
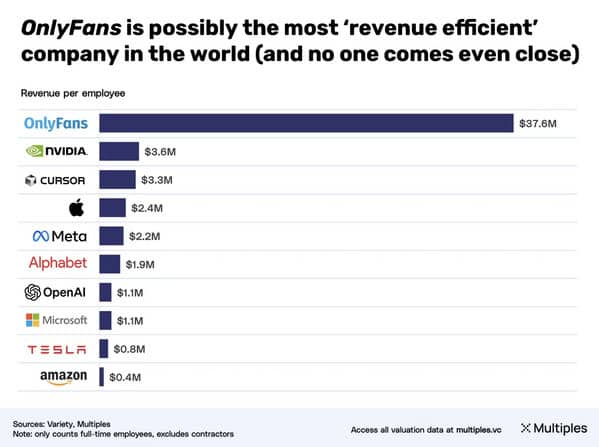
2. “OnlyFans brings more revenue per employee than NVIDIA, Apple, Tesla etc. combined”
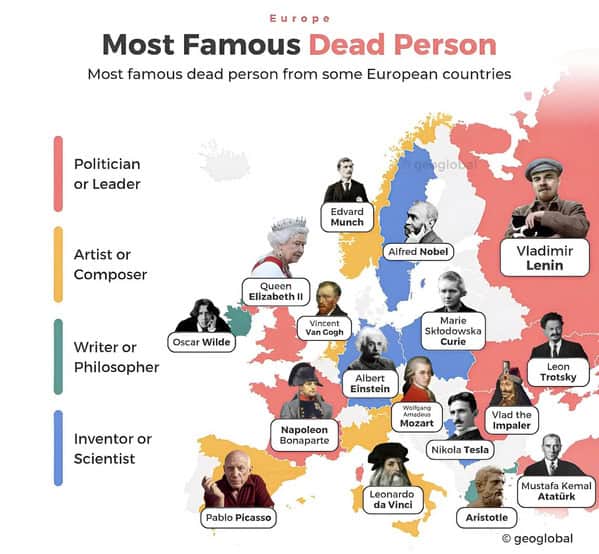
3. “A cool guide to the Most Famous Dead Person in European Countries.”
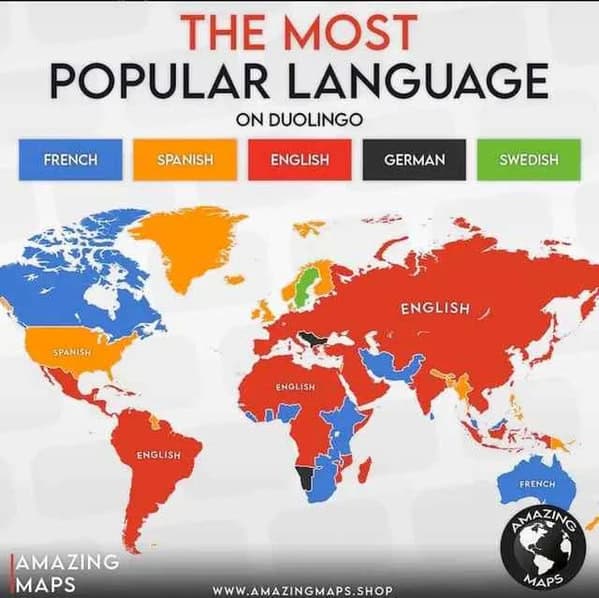
4. “A Cool Guide to the most popular languages on Duolingo”
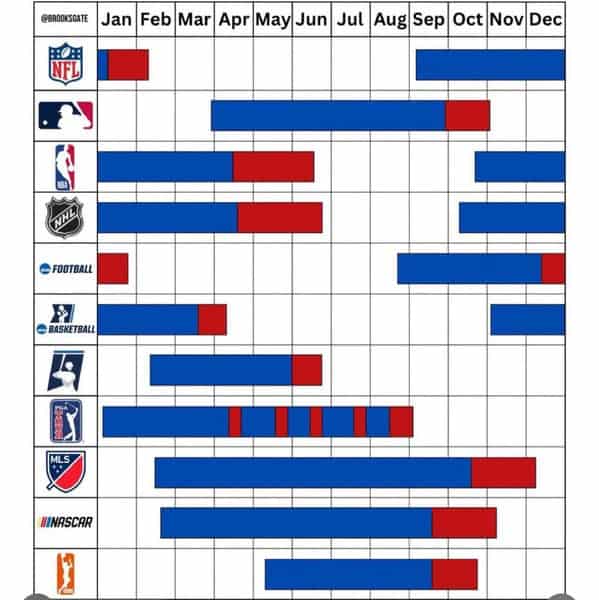
5. “A cool guide to American Sports seasons”
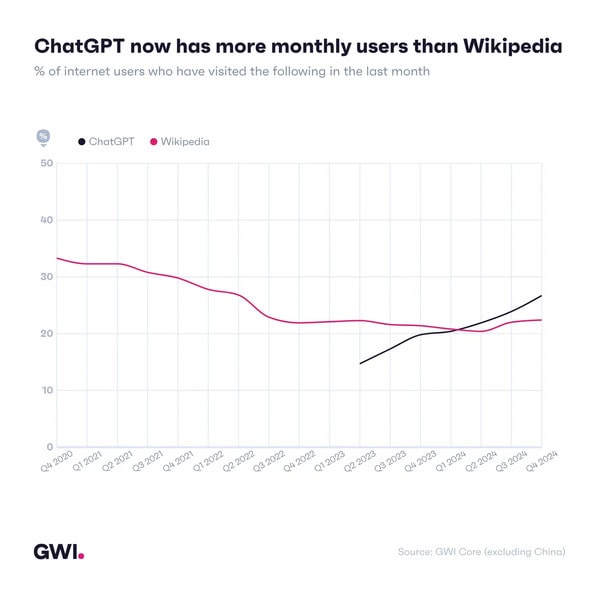
6. “ChatGPT now has more monthly users than Wikipedia”
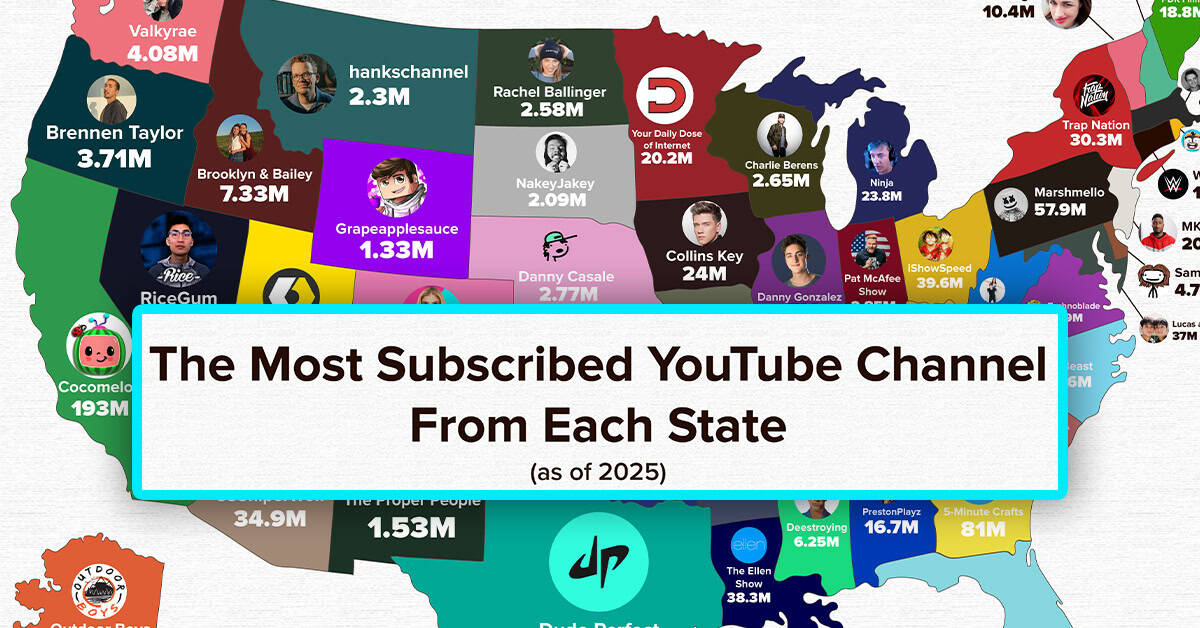
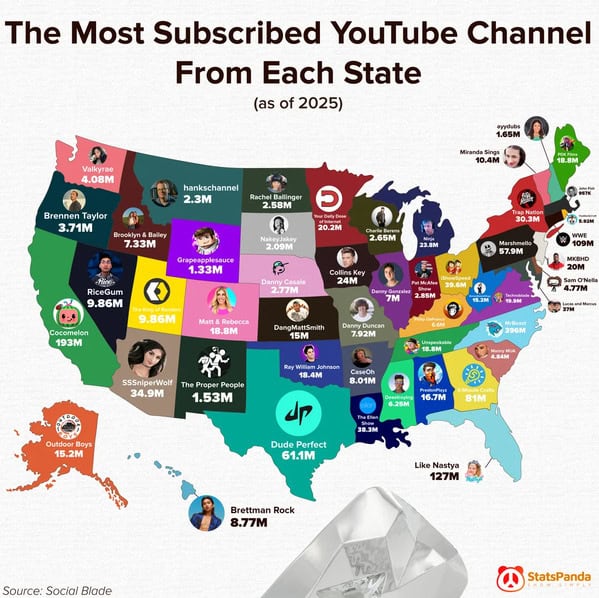
7. “A Cool Guide To The Most Subscribed YouTube Channel From Each State”
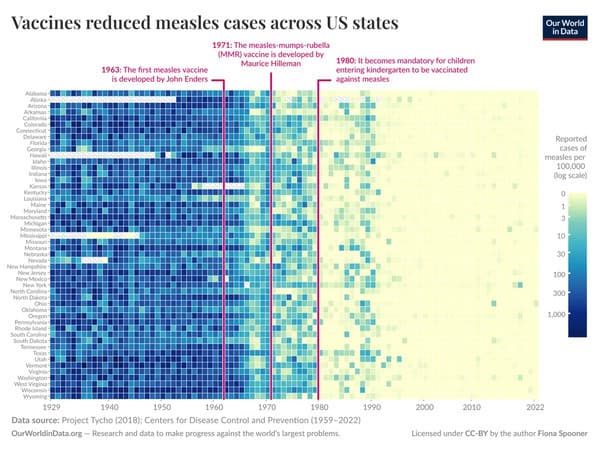
8. “Vaccines reduced measles cases across US states”
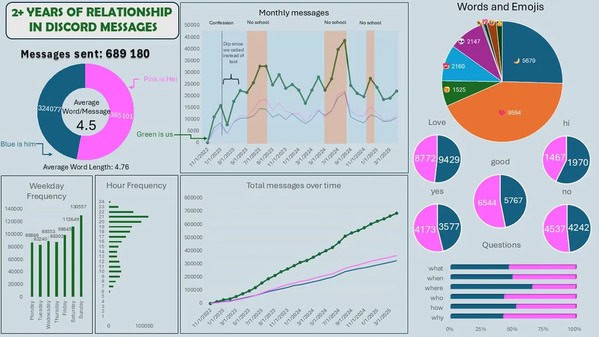
9. “689 180 messages between me and my girlfriend visualized”
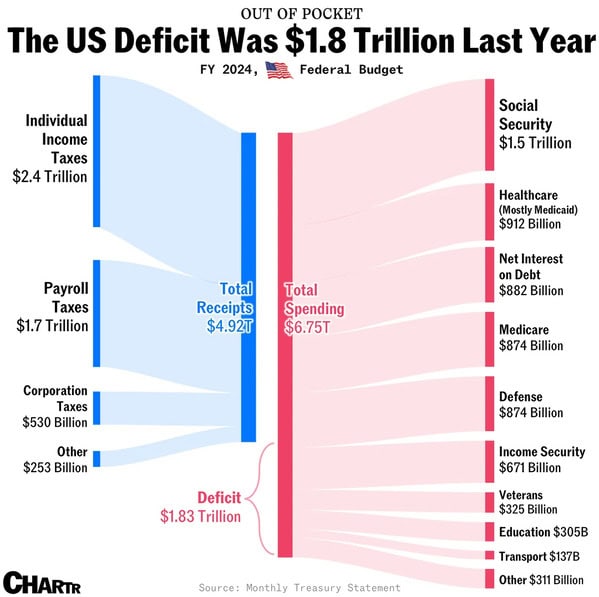
10. “The US Government’s Budget Last Year, In One Chart (FY2024)”
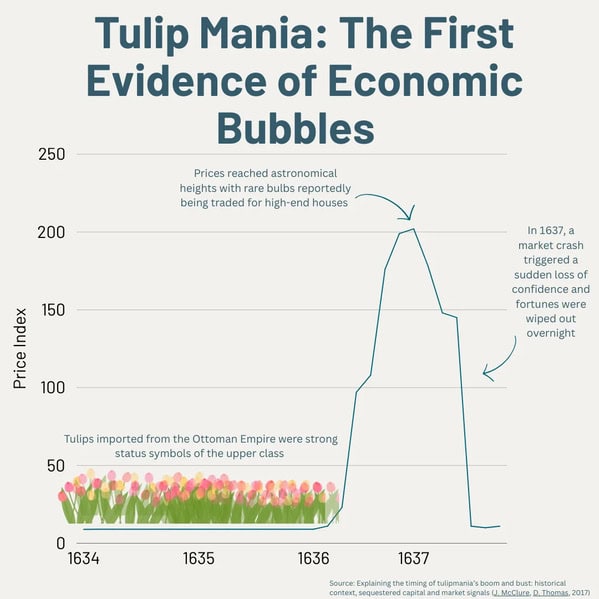
11. “The first recorded ‘economic bubble’ was Tulip Mania in the Netherlands in 1637.”
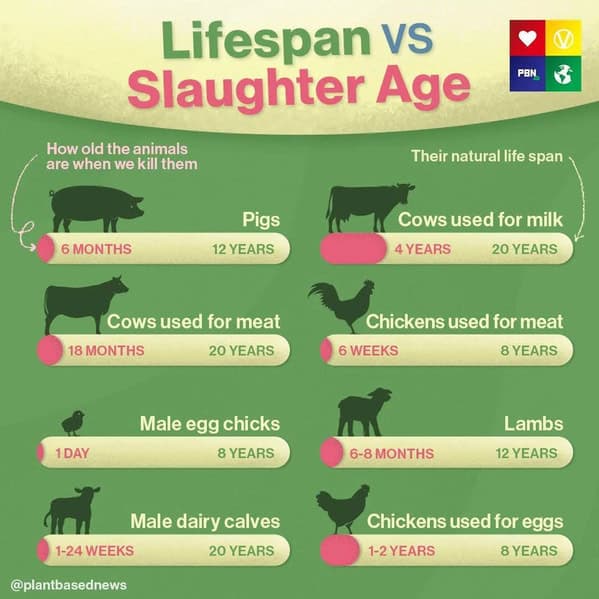
12. “A cool guide of the natural lifespan vs age killed of farmed animals”
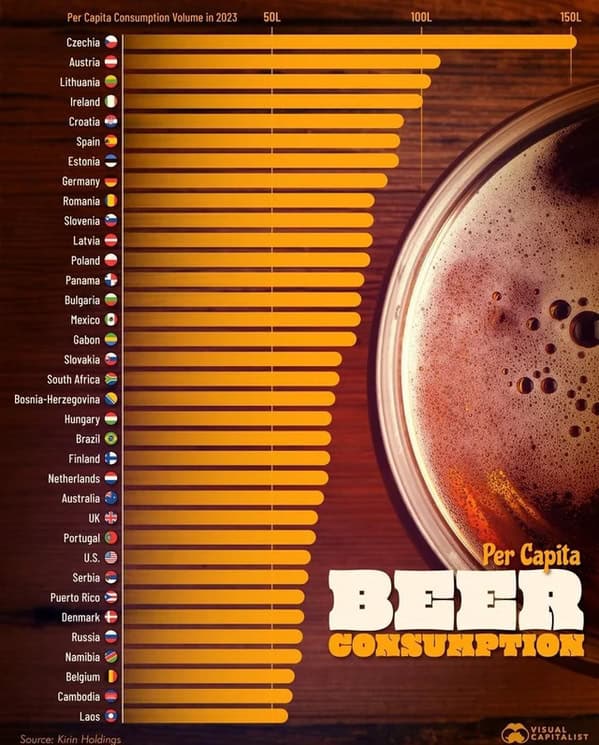
13. “A cool guide to beer consumption around the world”
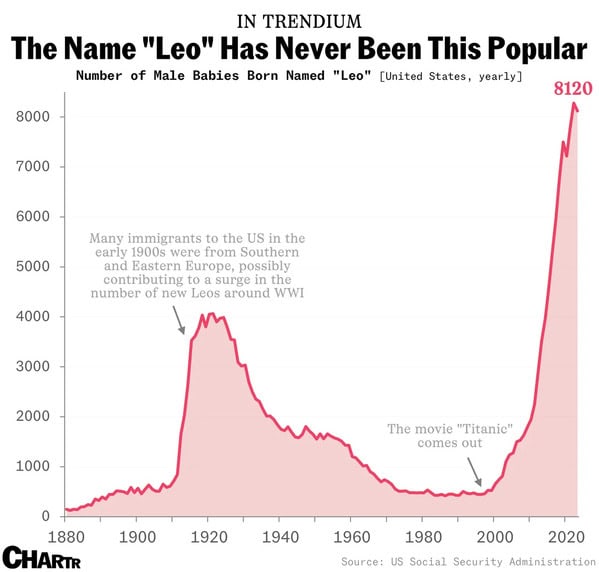
14. “The number of babies named Leo in America since 1880”
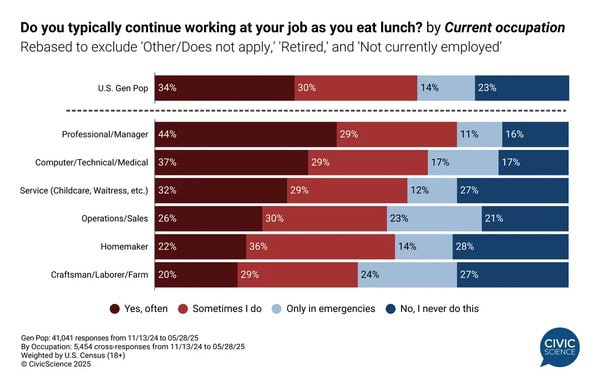
15. “34% of employed US Adults work through lunch ‘often'”
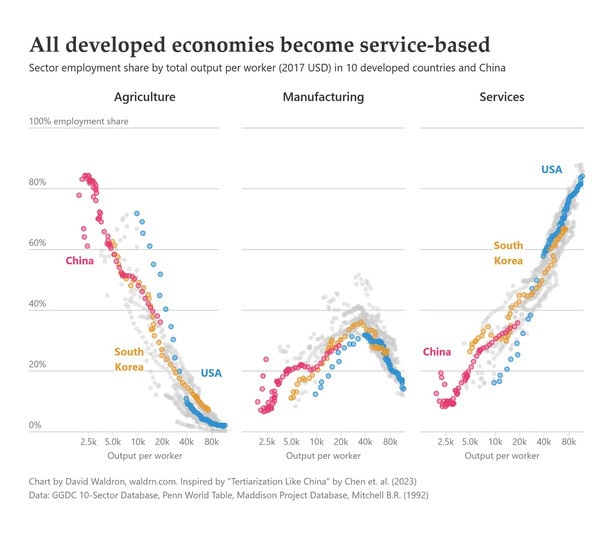
16. “Developed economies de-industrialize and become dominated by the services sector”
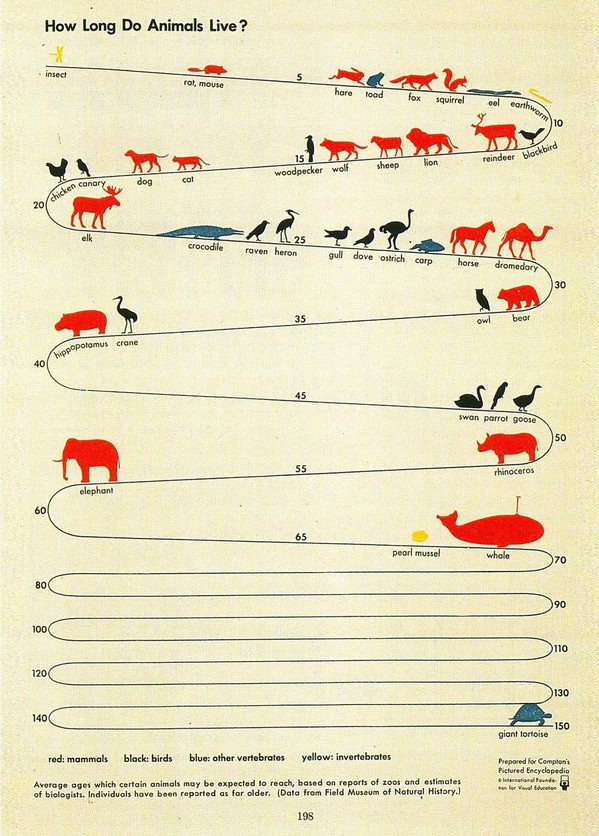
17. “A cool guide on How Long Do Animals Live?”
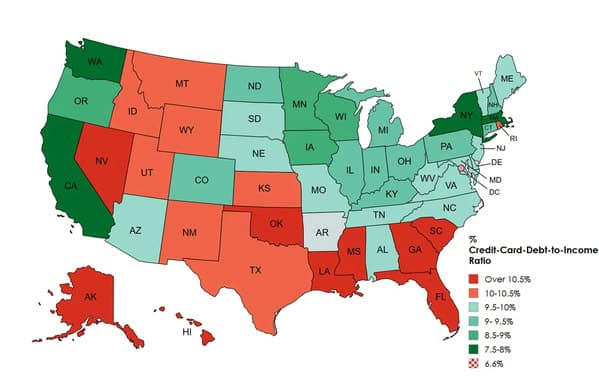
18. “Credit card debt to income”
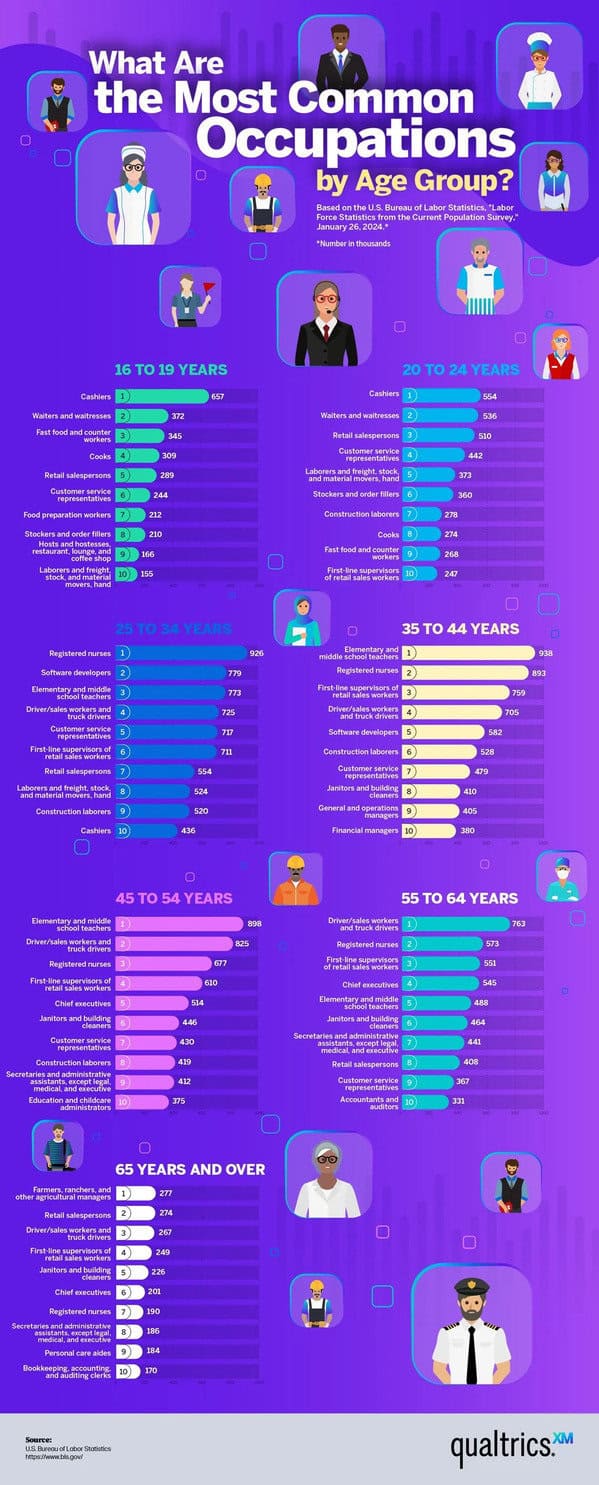
19. “A cool guide to the most common occupations by generation.”
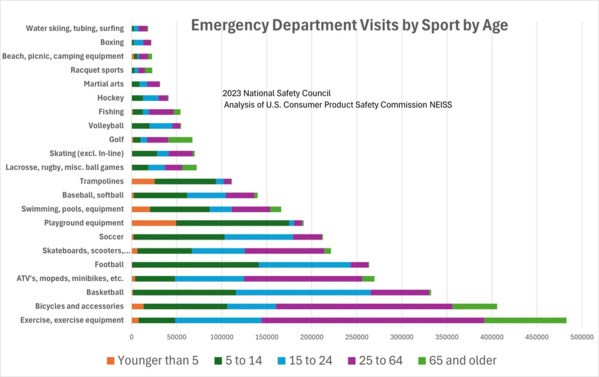
20. “Emergency Department Visits by Sport by Age”
21. “Brazil has the 3rd-most Formula 1 wins ever”

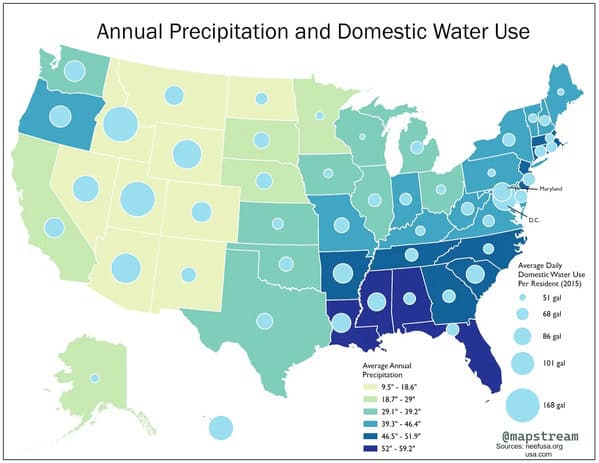
22. “Annual Precipitation and Domestic Water Use”
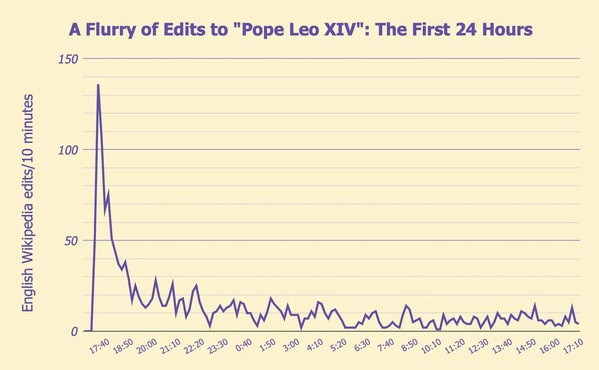
23. “Edits to Pope Leo XIV’s Wikipedia article per 10 minutes”
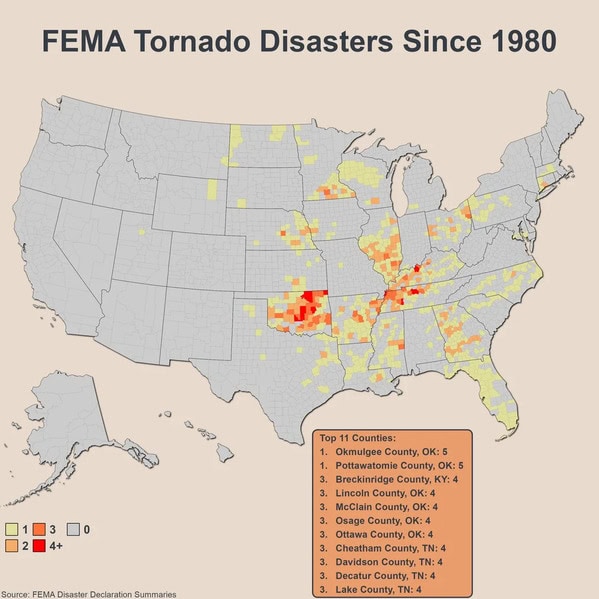
24. “FEMA Tornado Disasters Since 1980”
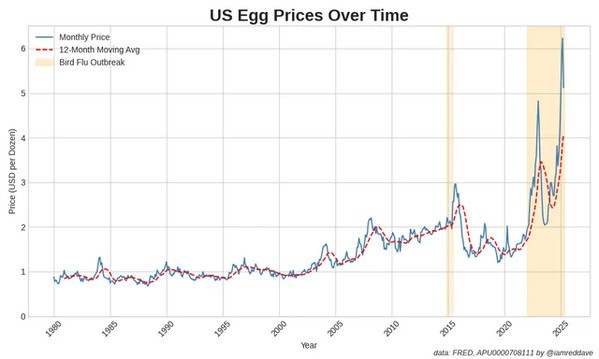
25. “Egg Prices in the US”
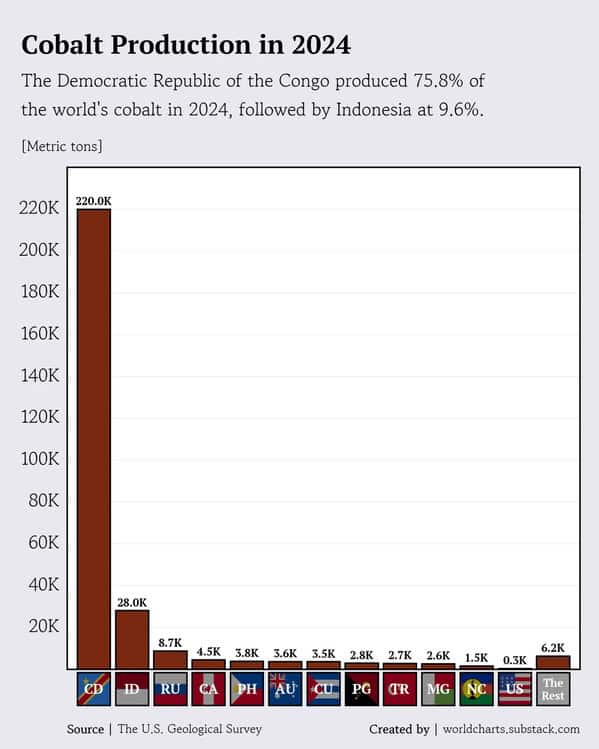
26. “Cobalt Production in 2024”
27. “Average Album Length 1964 – 2024”
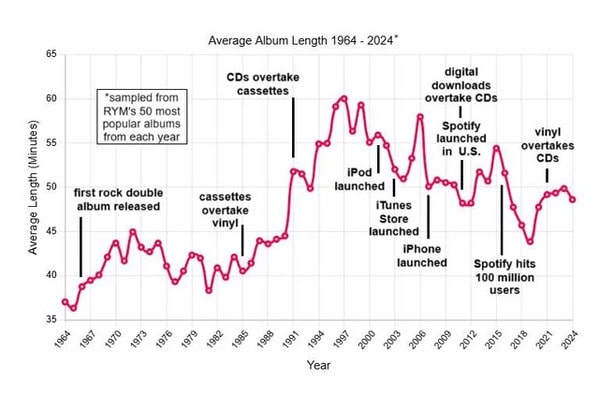
“As the visualization says, I averaged the lengths of the 50 most popular (i.e. most frequently logged, not most highly rated) albums for each year on RateYourMusic.
I removed two extreme outliers (Natural Snow Buildings by Daughter of Darkness [7:20:00] and Glitch Princess by yeule [5:27:18]) but otherwise let the data speak for itself.
I added labels for key milestones in the develop of recorded music to help contextualize the data, but I leave it to the viewer to decide the extent to which these indicate a causal relationship.”
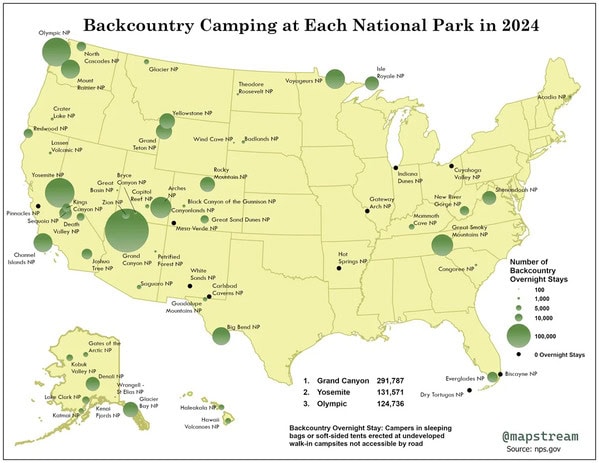
28. “Backcountry Camping at each US National Park”
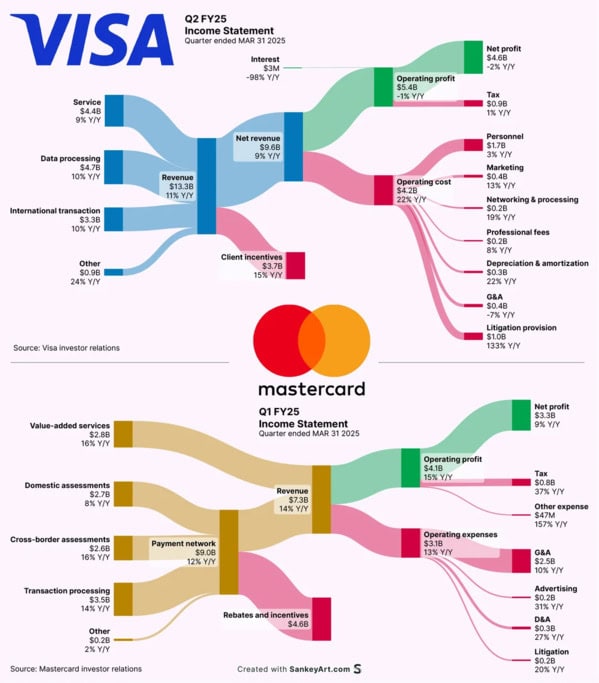
29. “How Visa + Mastercard made their latest Billions”
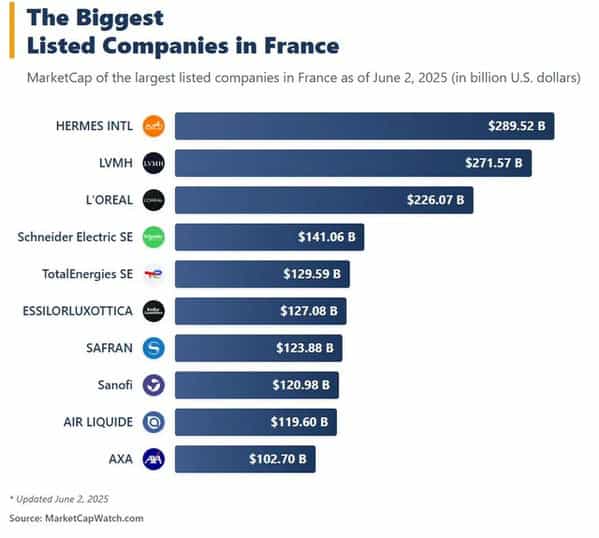
30. “The Biggest Listed Companies in France”
