37 Charts, Graphs, And Maps That Put Humor Above The Information
I love learning new information, and I love comedy, so when the two come together, I’m an easy mark. Give me a chart, graph, or map that looks educational at first glance but is really just setting up a joke, and I’m already in.
There’s something especially funny about using the serious language of data to present something completely ridiculous. It gives nonsense a weird amount of authority.
These are the kinds of visuals that may not make you smarter, but they will absolutely improve your day.
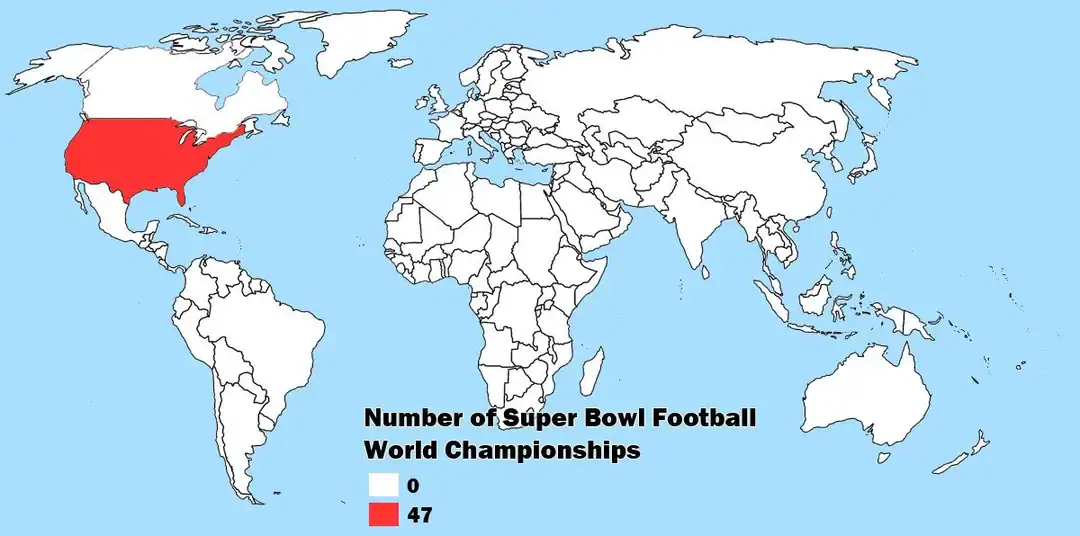
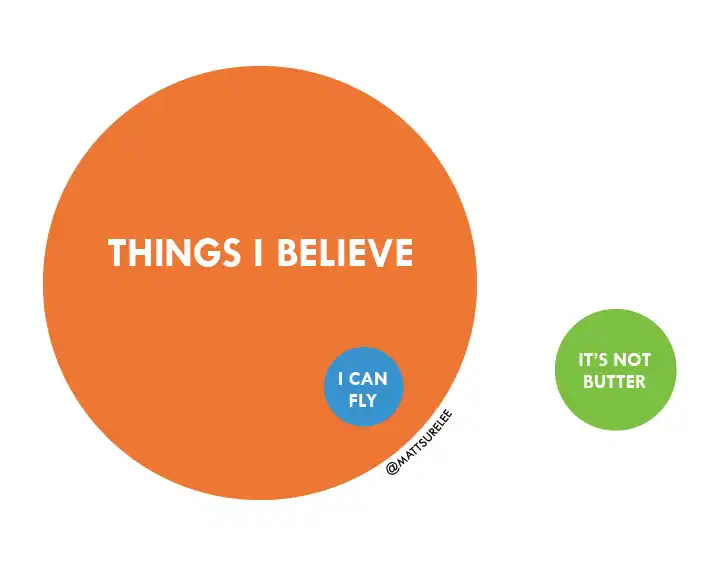
1.

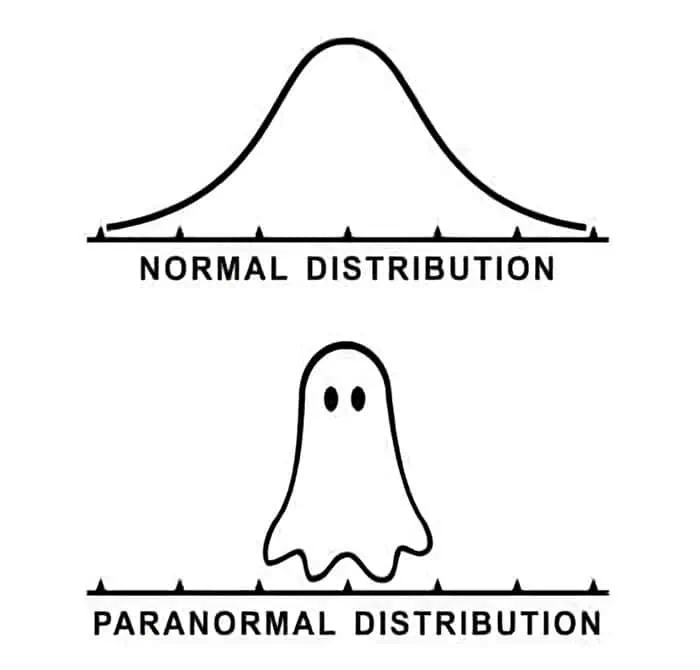
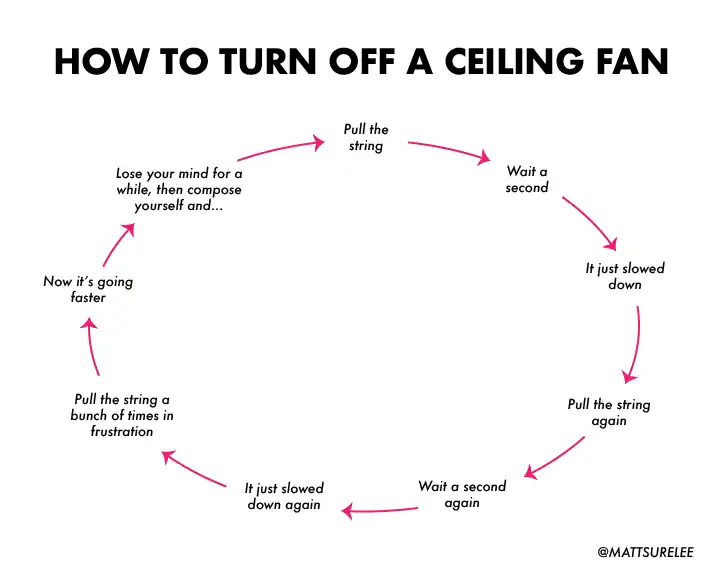
2.

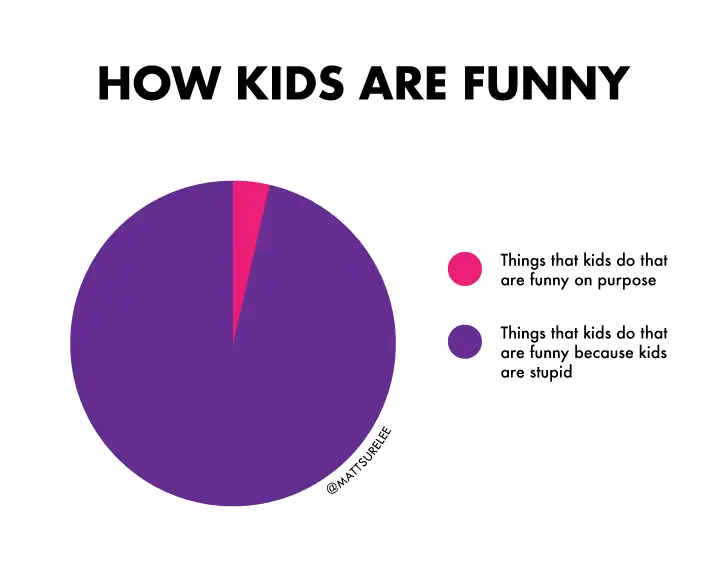
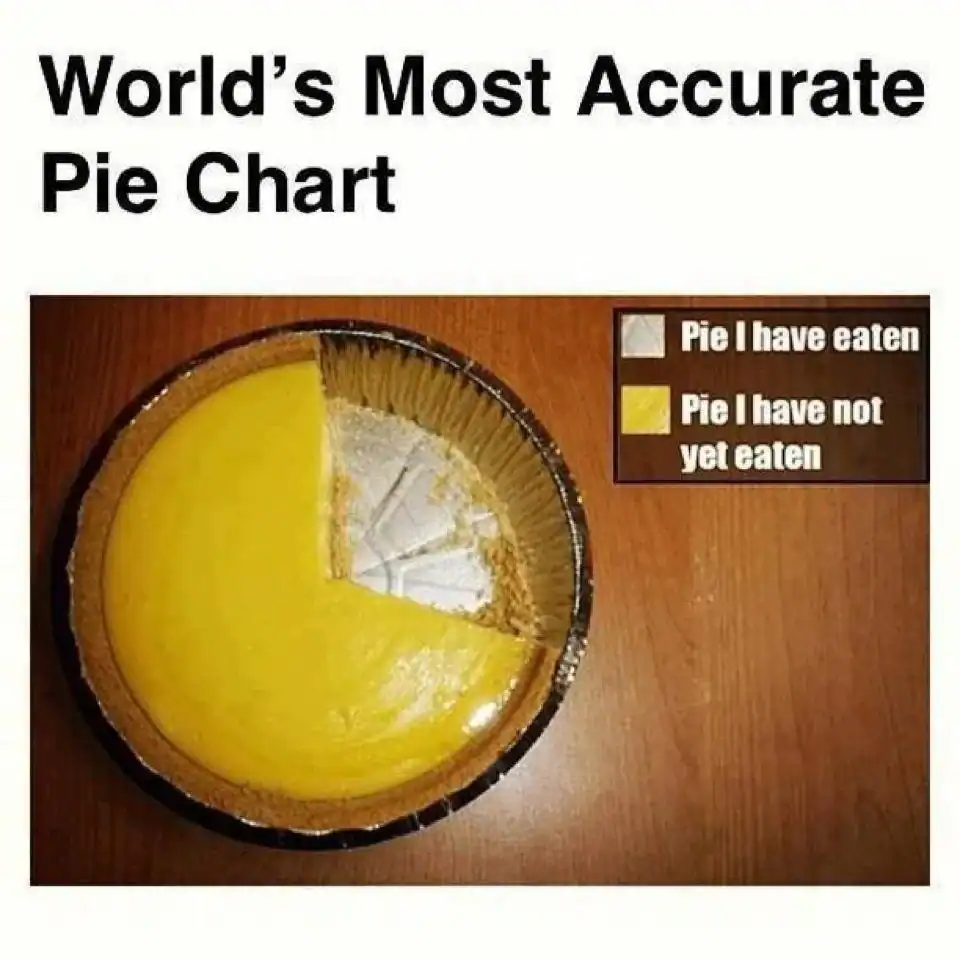
3.

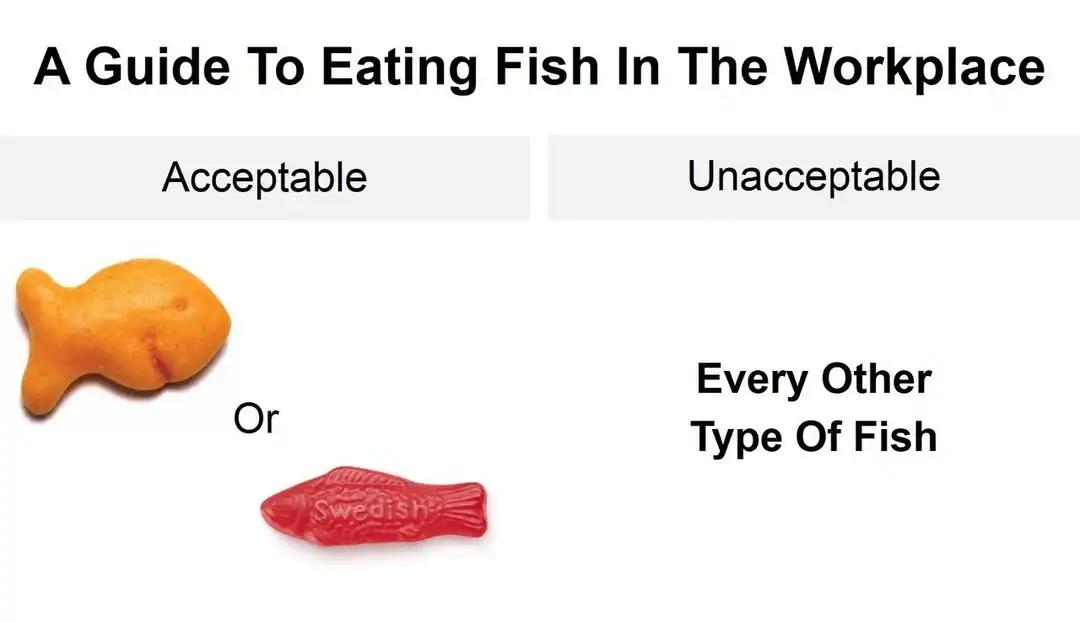
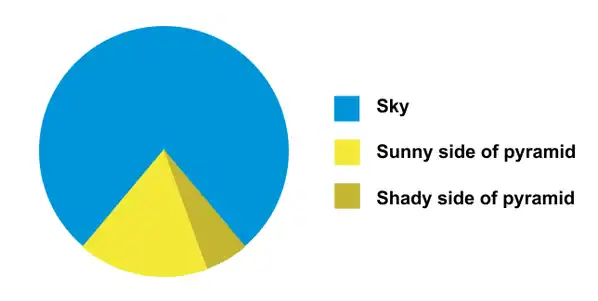
4.

5.
6.

7.

8.

9.
10.

11.

12.

13.

14.
15.
16.
17.

18.
19.

20.

21.

22.
23.
24.

25.

26.

27.

28.
29.
30.
31.

32.

33.

34.

35.

36.
37.