Data Is Beautiful (21 Charts & Graphs)
I’d did my best to keep this fun. I know this is a turbulent time, but it is an important time. So, enjoy this data then get back out there and keep changing the world for the better.
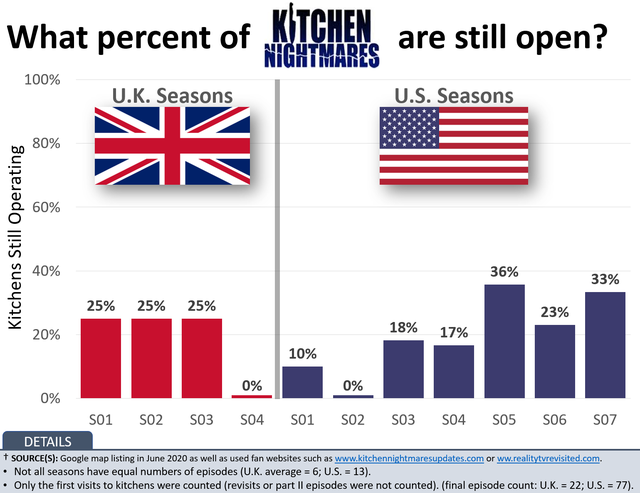
1. What percent Gordon Ramsay’s Kitchen Nightmares are still open?
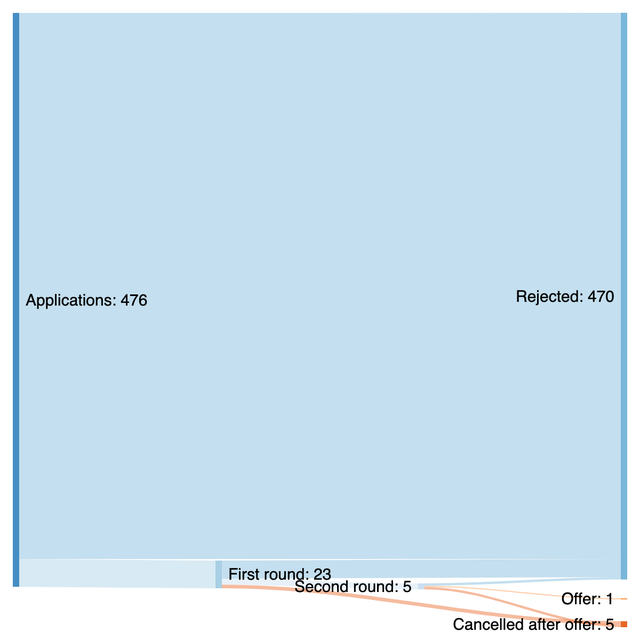
2. My pandemic job search for entry level software engineering positions.
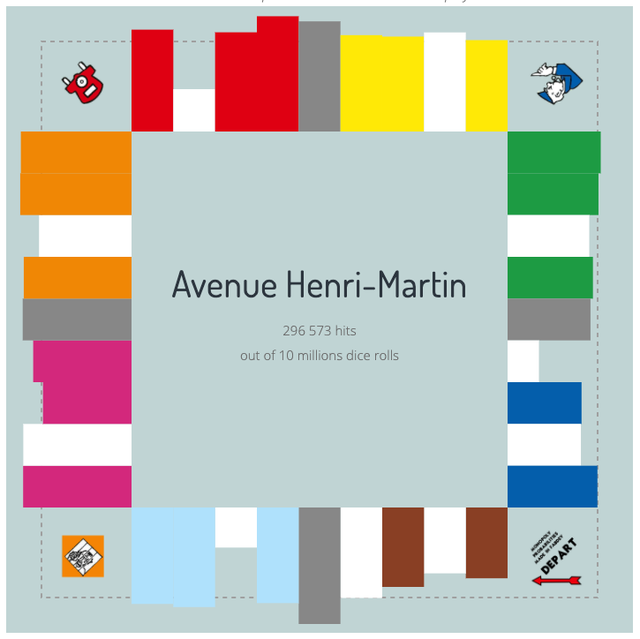
3. Monopoly probability distribution based on 10 millions dice rolls.
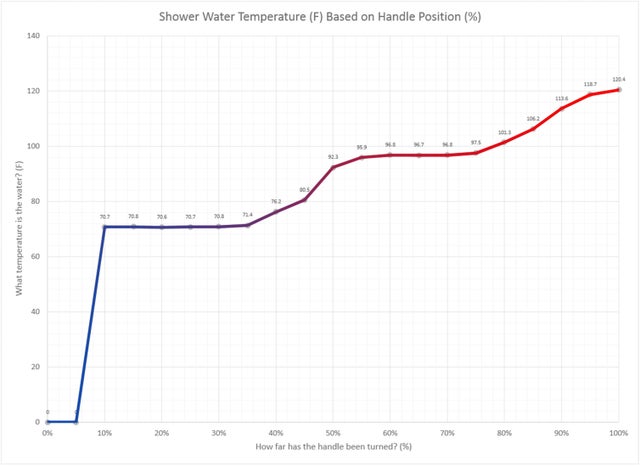
4. Shower Temperature Compared to Handle Position
5. The Cost of Sequencing the Human Genome.

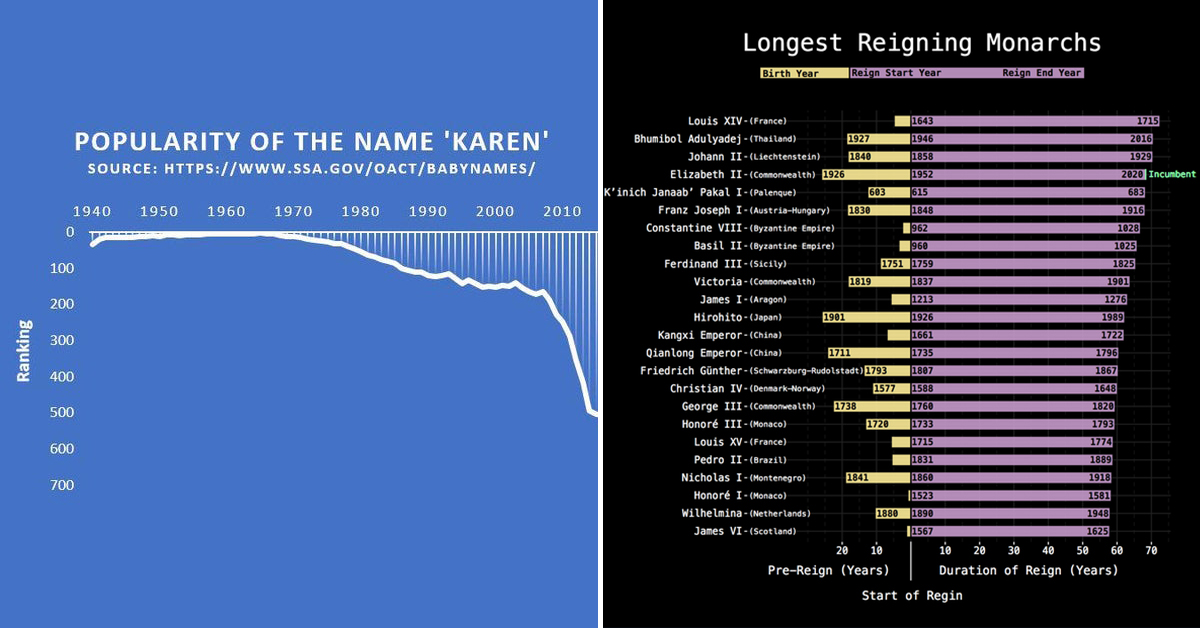
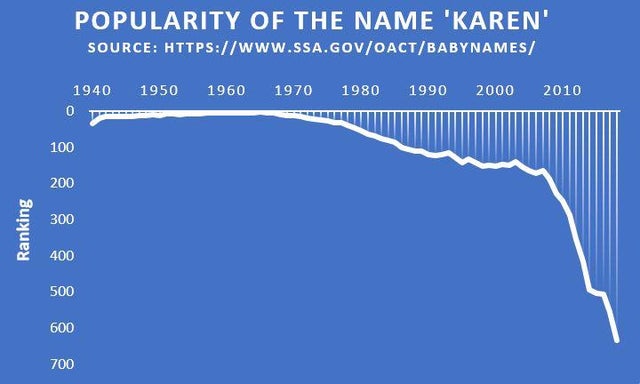
6. The popularity of the name ‘Karen’ has seen a dramatic decrease within the last ten years.
7. Hydrogen Electron Clouds in 2D

8. The Simpsons references to drugs / alcohol and sex.

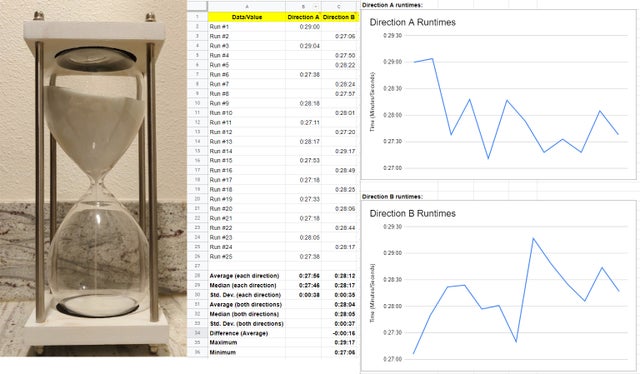
9. Testing the Accuracy and Precision of a Cheap Decorative Hourglass
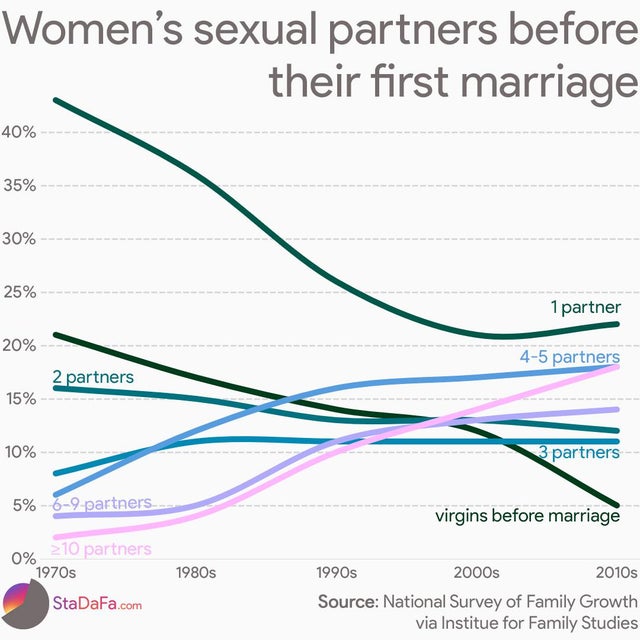
10. Women’s sexual partners before their first marriage.
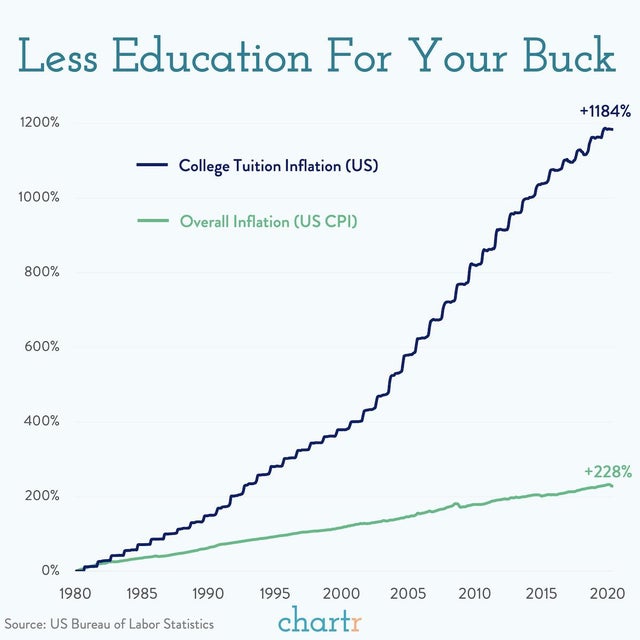
11. US College Tuition & Fees vs. Overall Inflation
12. Nine years of viewing history in Netflix

13. The best (& worst) countries for raising a family (2020)

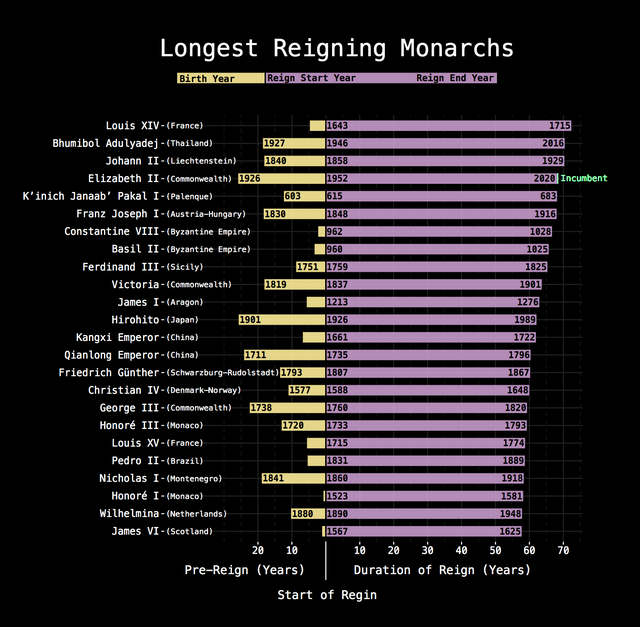
14. Longest Reigning Monarchs
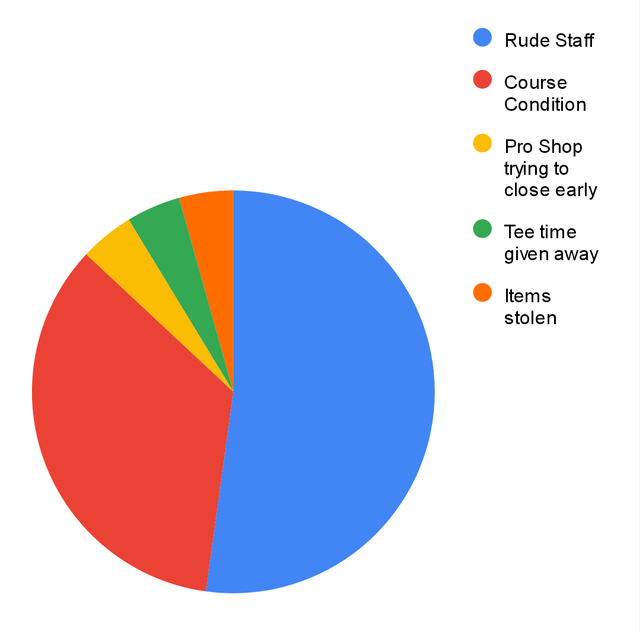
15. I work at a Golf Course, got bored and wanted to investigate the reasonings behind our 46 1 & 2-star reviews.
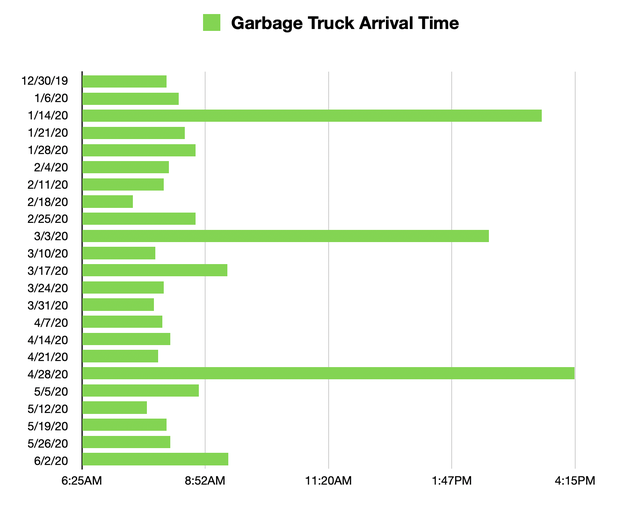
16. I’ve been recording what time the garbage truck picks up my trash using my doorbell camera. It seems roughly every 2 months, they have a “training truck” that comes by much later in the day. Probably a rookie driver is learning how to use the robot arm…
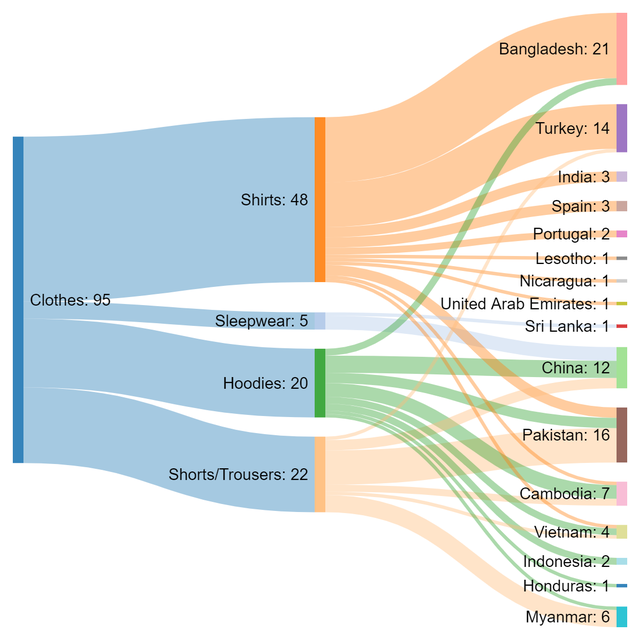
17. Which countries produce the most (of my) clothes?
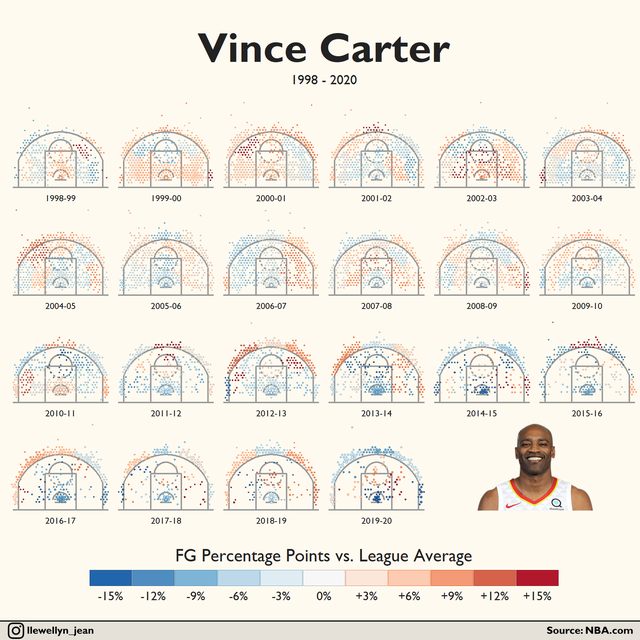
18. After 22 years in the NBA, Vince Carter is retiring from professional basketball. Here’s a shot chart for every year he was in the league.
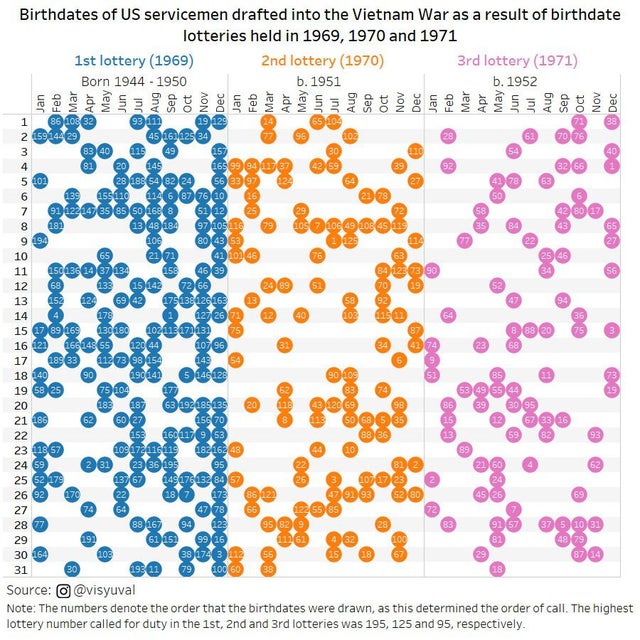
19. Birthdates of US servicemen drafted into the Vietnam War as a result of birthdate lotteries held in 1969, 1970 and 1971
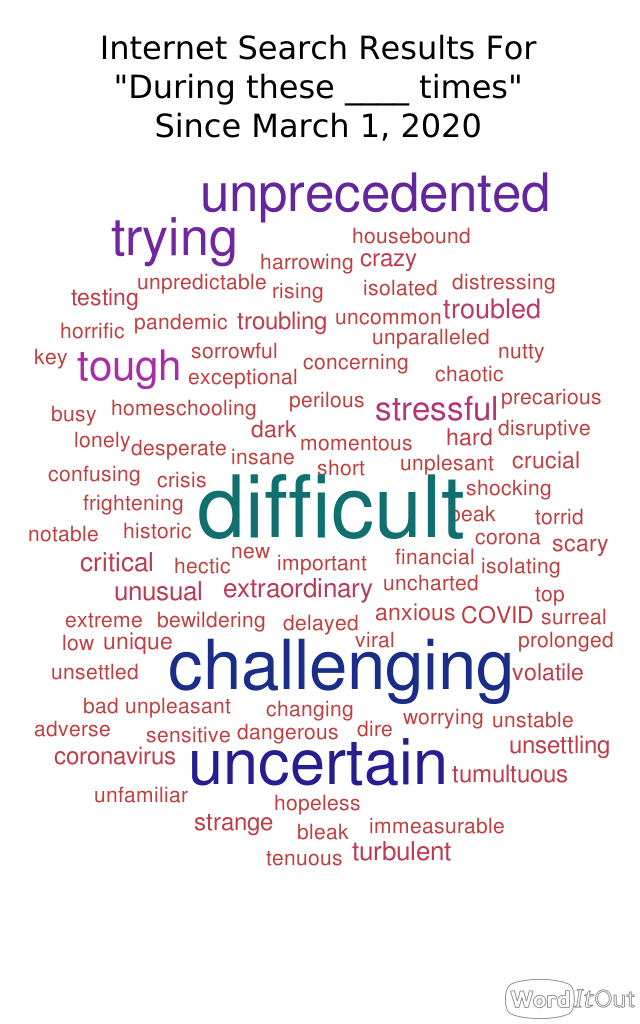
20. I wrote code to search the web for instances of “During these ____ times” written since the beginning of March. After thousands of results, here’s my initial findings.
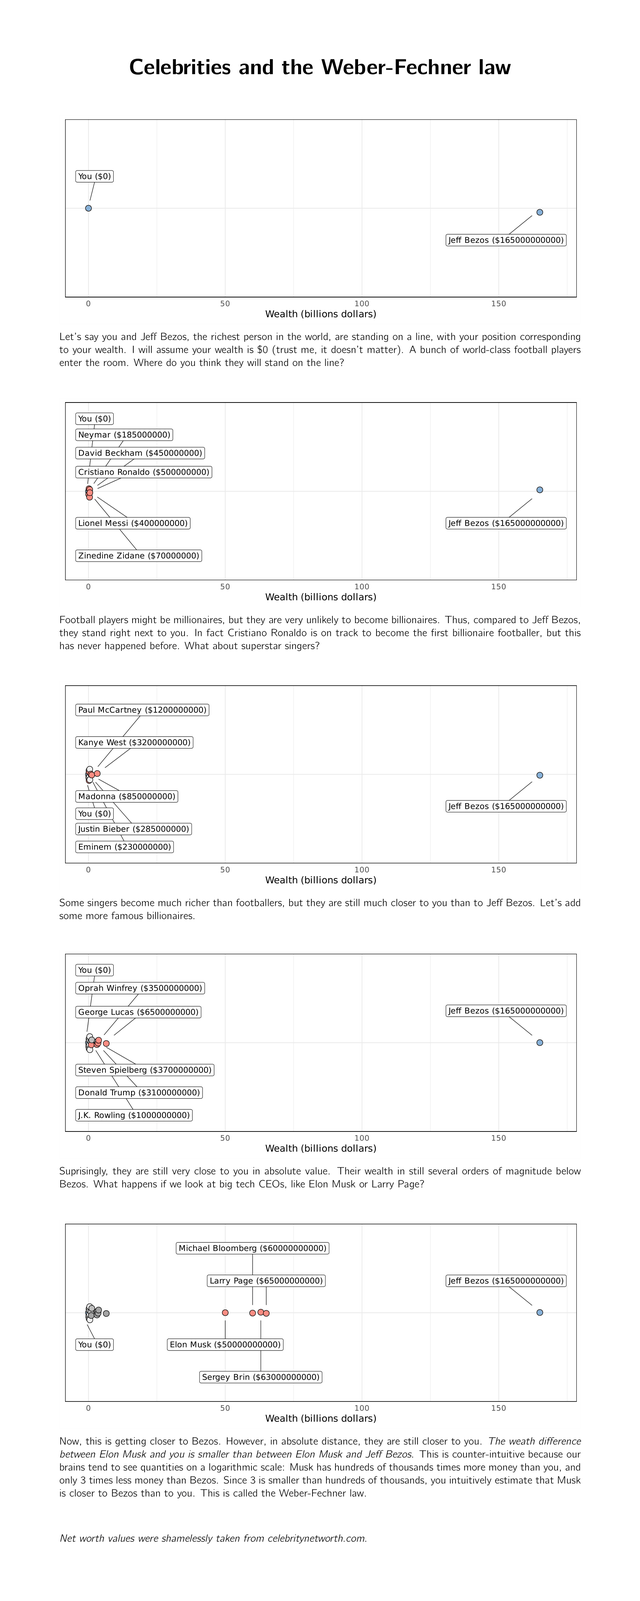
21. Believe it or not, the wealth of Elon Musk is closer to your wealth than to the wealth of Jeff Bezos.
