I did my best to work in a bunch of non-COVID-19 related posts, but it’s kind of all anyone is thinking or talking about. I’m sure you’re feeling the fatigue from the bombardment of coronavirus news, so I’ll do my best to keep a good mix coming your way.
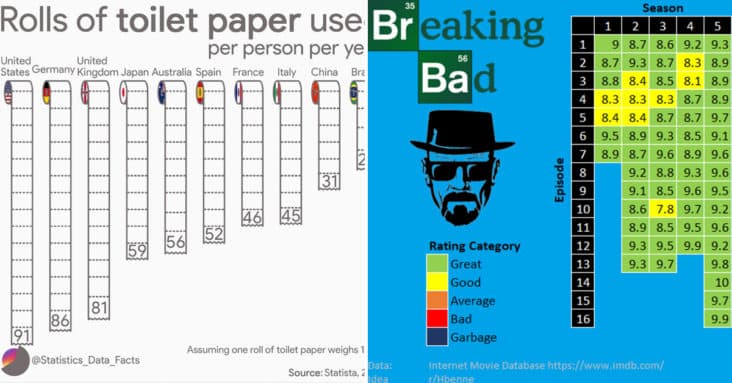
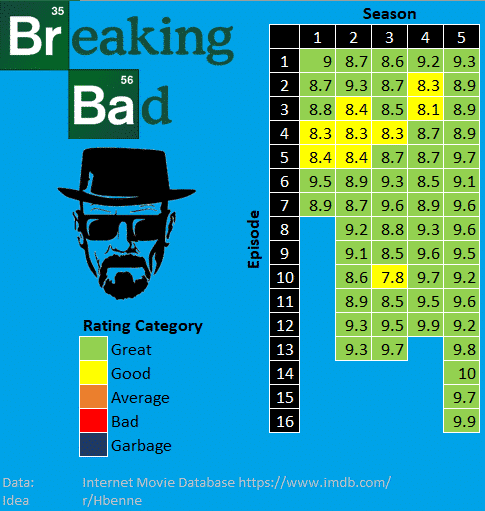
1. The absolute quality of Breaking Bad.
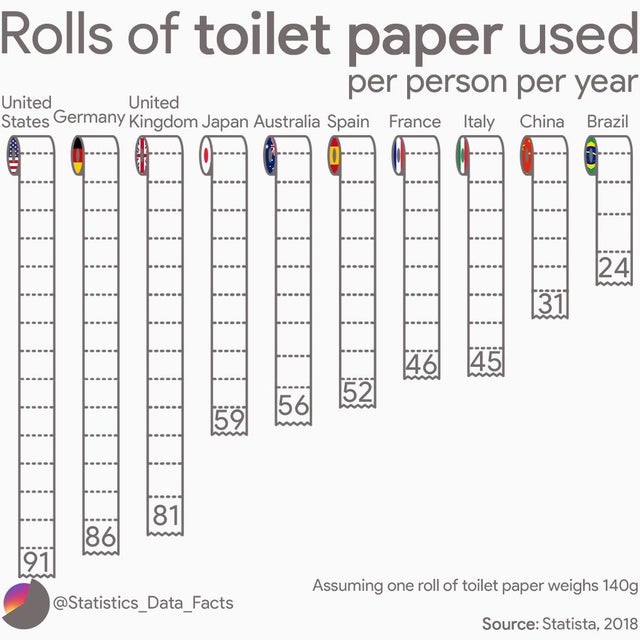
2. Rolls of toilet paper used per person per year.
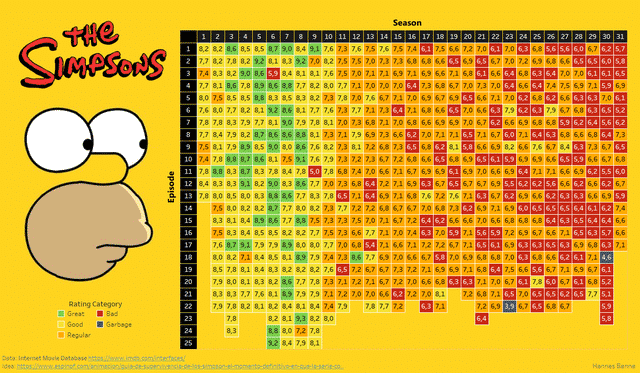
3. Rating of Simpsons episodes according to IMDB score.
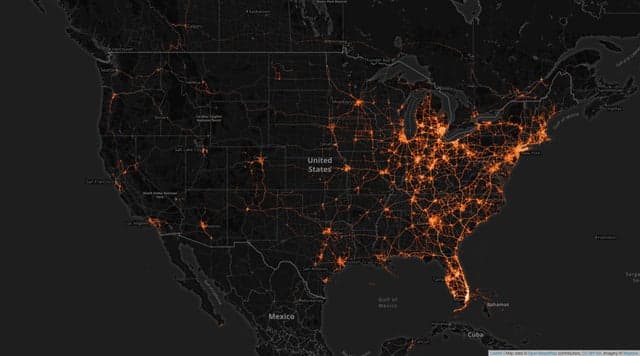
4. Image showing secondary locations of anonymized mobile devices that were active at a single Fort Lauderdale beach during spring break 2020.
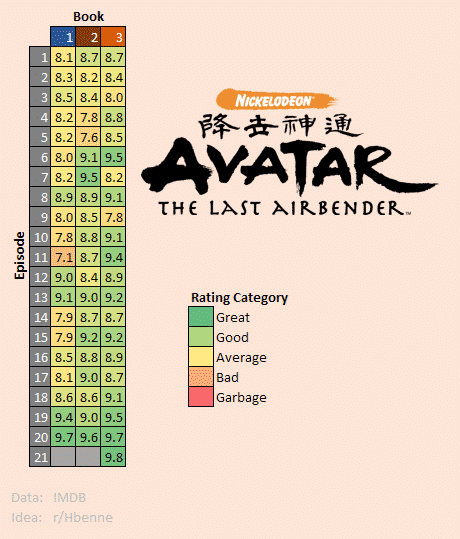
5. Avatar the Last Airbender – IMDB Scores
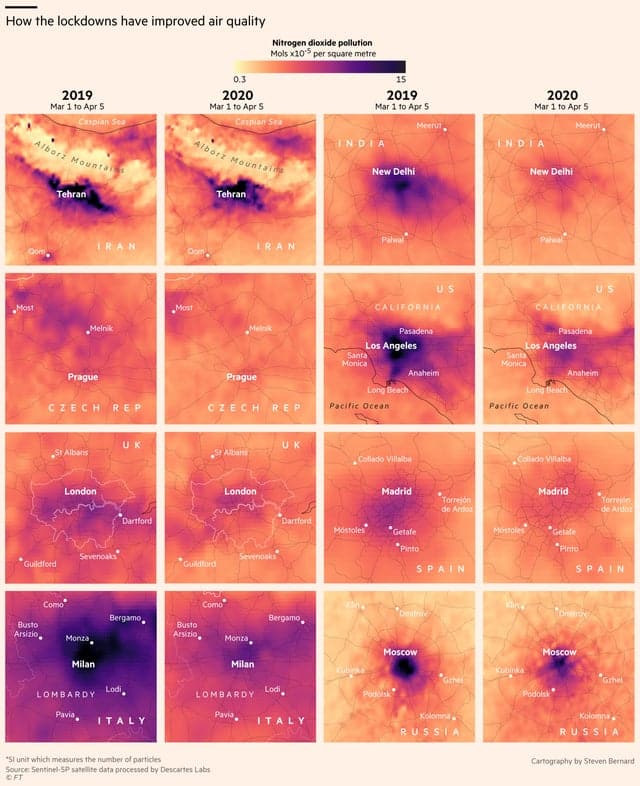
6. NO2 pollution maps of major cities during Covid-19 lockdowns compared to the same period last year.
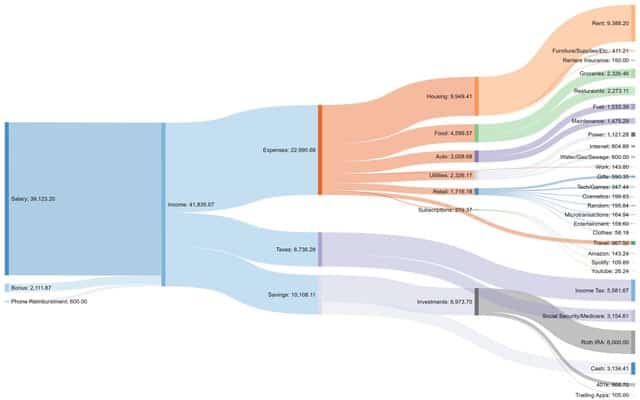
7. A full year of income and expenses through my first year living by myself!
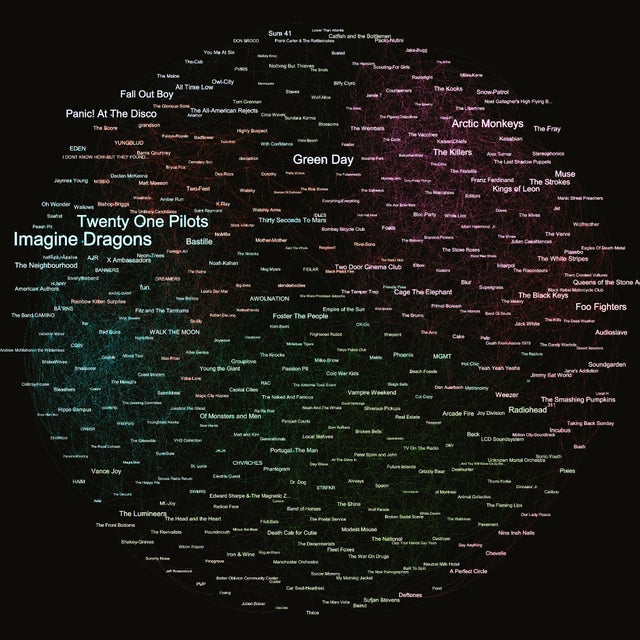
8. Spotify artist’s relation network according to their fan bases.
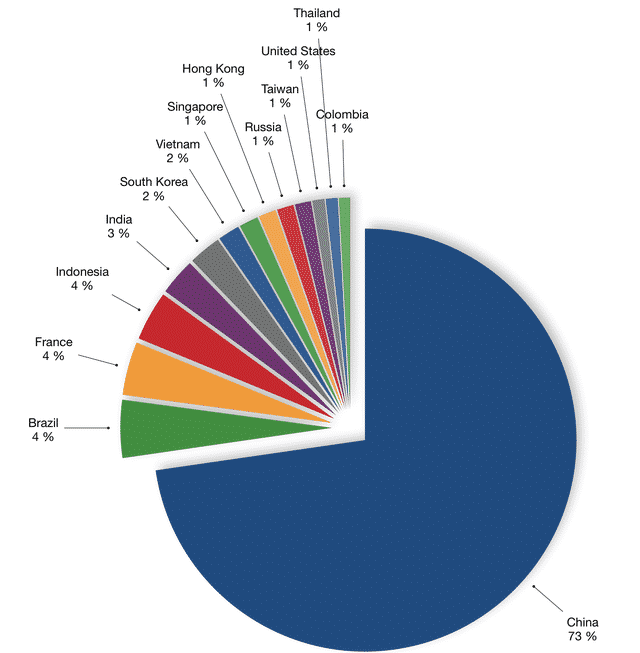
9. Country of origin of failed login attempts into my webserver.
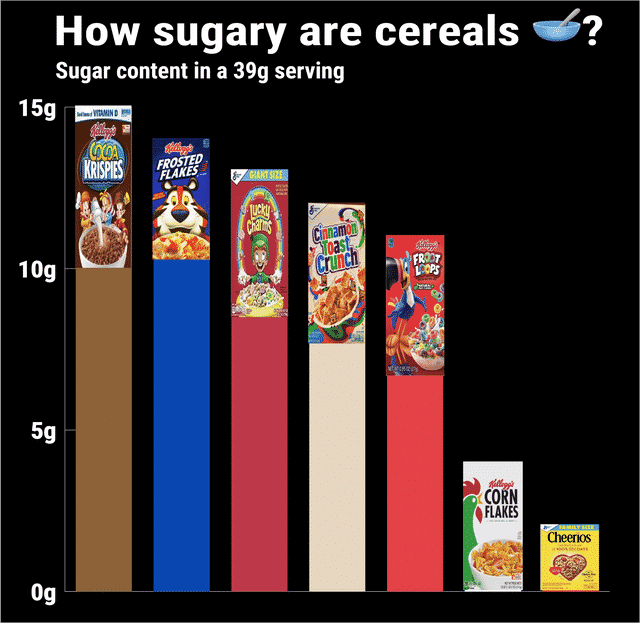
10. How Sugary can these cereals get?
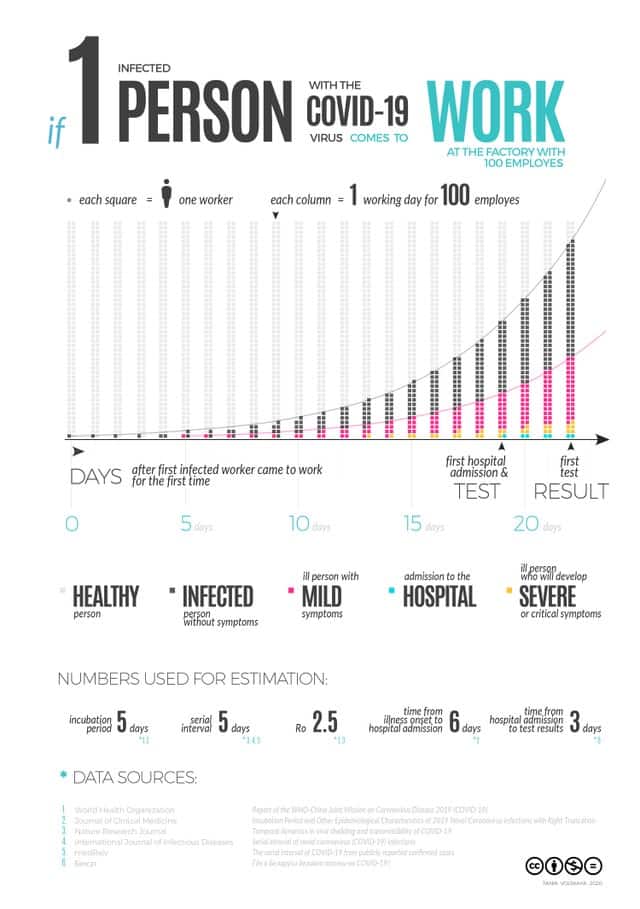
11. COVID-19 spread in the factory with 100 workers from one infected person.
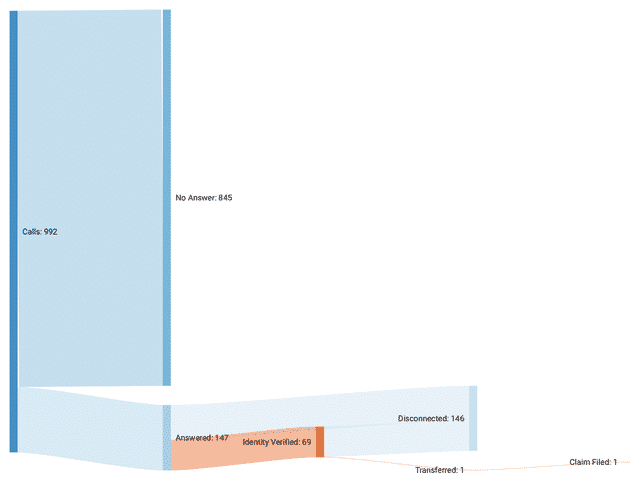
12. Attempts to file an unemployment claim in New York by phone.
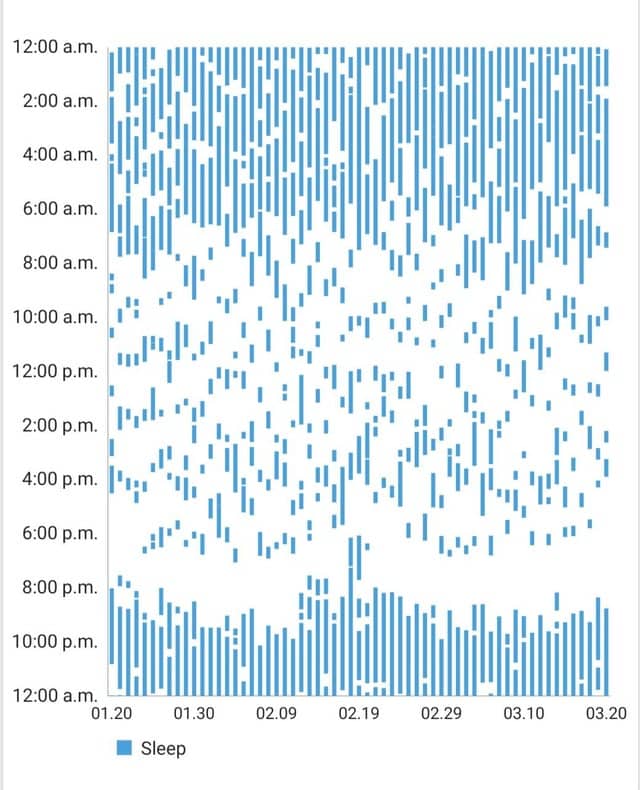
13. The sleep pattern of baby 3-6 months.
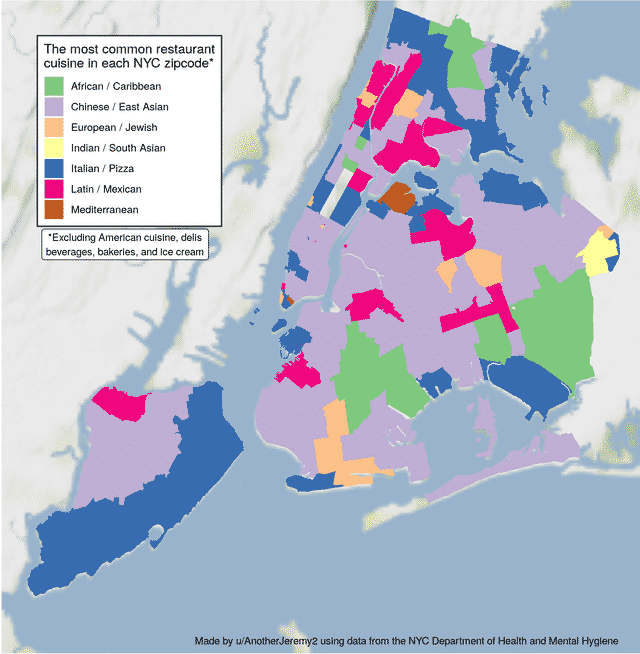
14. The most common restaurant cuisine by zip code in NYC.
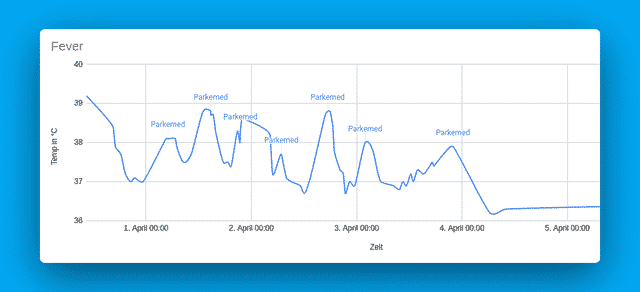
15. My fever curve while fighting the virus.
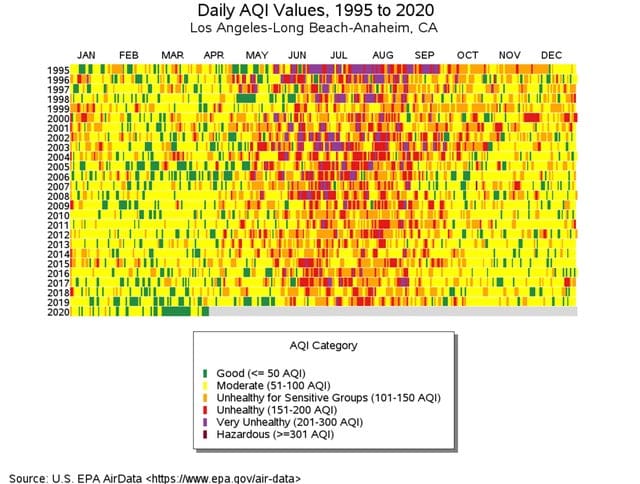
16. Los Angeles Air Quality Index 1995-2020
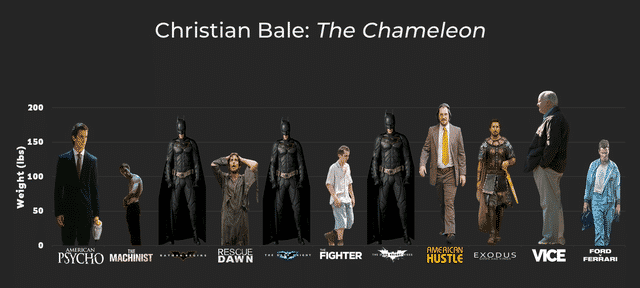
17. Christian Bale’s drastic weight changes across various movies.
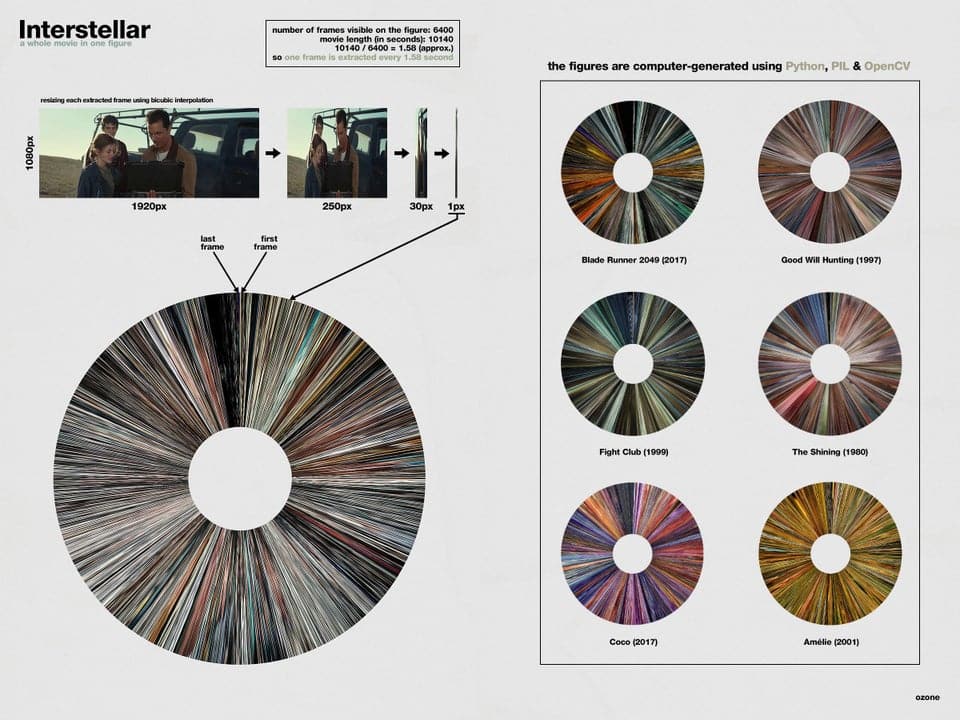
18. Visualizations of movies in one figure.
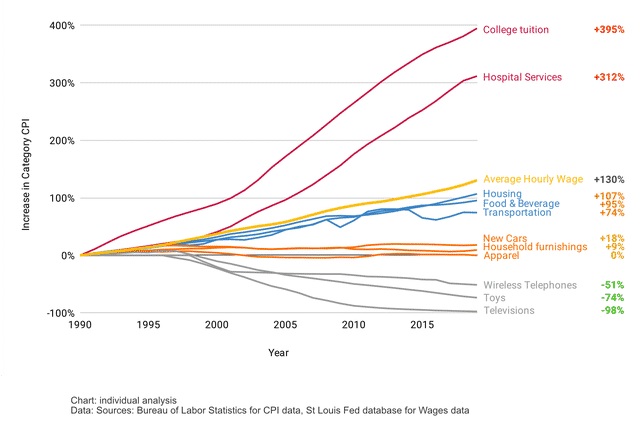
19. Price History over the past 30 years.
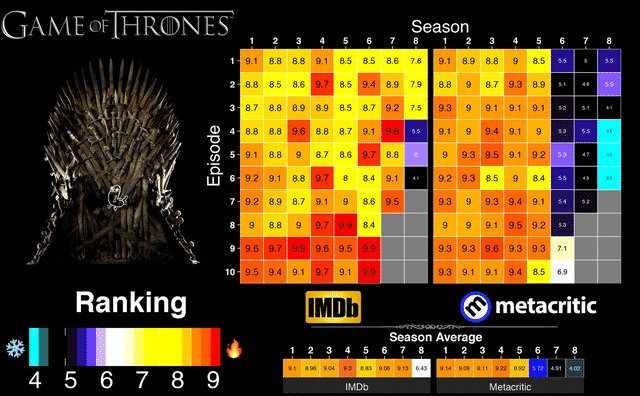
20. Game of Thrones Downfall – Metacritic vs. IMDb Ratings.
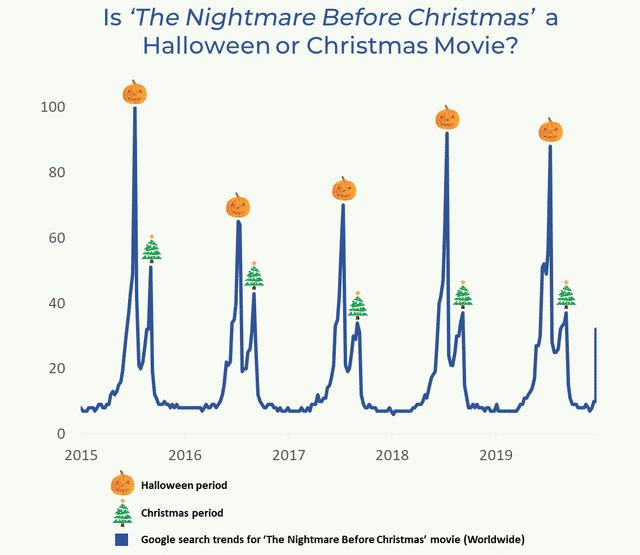
21. Is ‘The Nightmare Before Christmas’ a Halloween or Christmas movie? Google search trends might have an answer to the debate.
